Review of the Windows 7 Network Monitor
Network Monitor 3.3 is an upgrade which is specifically designed for Windows 7. What this utility does is capture TCP/IP packets, which are displayed in the GUI so that you can see source and destination addresses of the frames.
Topics for the Windows 7 Network Monitor
- The Secret of Network Monitoring
- Typical Tasks for Network Monitor
- What’s new in Network Monitor 3.3
- Data Capture
- Filters Make the Difference
- Enable Network Conversations
- 7 Tips for Windows Network Monitor
- NetFlow Traffic Analyzer
The Secret of Network Monitoring
The secret for success with the Windows 7 Network Monitor is that you must have a clear purpose; you need a real problem to solve. If you just toy with Network Monitor you will soon get bewildered with all the data captured, and give up. Thus if you don’t have a problem invent one!
Once you have a mission, your desire to succeed will ensure that you home in on just the facts you need. Then as you solve the problem, so you become a minor expert on Network Monitor.
The classic mistake is thinking that Network Monitor is built-in to the Windows 7 operating system and you activate it via the ‘Features’ or ‘Windows Components’. Wrong. In fact, the secret of installing the Windows 7 Network Monitor 3.3 is to download this free utility from Microsoft’s site. (Sorry I cannot give a more specific URL but Microsoft keep upgrading and changing the URL!)
What’s New in Windows 7 Network Monitor 3.3
- The ability to capture on WWAN and Tunnel interfaces on Windows 7.
- Critical fixes to Network Monitor 3.3 so that it operates correctly with Hyper-V.
- A nifty technique called: Right-click-add-to-alias. Simply right-click a frame in the Summary window with then add that address as a new alias. Works with an IPv4, IPv6, or MAC address.
- With Auto-scroll you can click to see the most recent traffic, or click Auto-scroll again to freeze the view at its present location.
- Get extra help with ‘Experts online’: Experts are stand-alone applications that analyze Network Monitor capture data. Various experts are available online in conjunction with CodePlex.
What was New in Network Monitor 3.2
- Network Conversations is a new feature which segregates related frames and displays them in groups.
- Process tracking works by categorizing packets based on the ID of the process. Check for rogue processes, also learn about ‘good’ processes.
- Improved GUI. Try resizing the windows, also drag and drop windows to achieve a clearer interface.
Typical Tasks for the Windows 7 Network Monitor
Troubleshooting connectivity problems.
Let us imagine that you cannot contact a server. If you capture the appropriate frames with the Network Monitor, you may discover from the destination address that your machine is trying to connect does not exist.
Calculating server response times.
Each packet has time /date information, thus you can measure response times for conversations between your computer and other machines on the network. If necessary you could initiate a conversation with a ping command.
TCP re-transmissions. 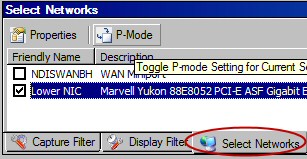
A large number of TCP re-transmissions could indicate a faulty wire (or wireless) connection.
Your first task is to find, and then research the P-Mode button. The ‘P’ stands for promiscuous capture.
Data Capture
In order to capture data, you should install both the Network Monitor and its driver on the local computer. The Network Monitor driver enables the Netmon executable to receive and display frames from your network card.
Once netmon.exe has captured the frames from the network card, its parsers analyze the raw and display the information in the GUI. As a result you can read the all the information carried within the packets, including unencrypted passwords and other sensitive information.
Guy Recommends SolarWinds’ Free Network Monitor

Thus utility makes it easy to check the health of a router or firewall. Check the real-time performance and availability statistics for any device on your network.
Get started with an extensive collection of "out-of-the-box" monitors for popular network devices.
Download your free Network Device Monitor
Filters Make the Difference Between Success and Failure
Filters, especially capture filters, make all the difference between seeing manageable data in the monitor, or viewing a mass of meaningless numbers. For example, create a filter which captures only http traffic.
Filter menu, Capture Filter –> Load Filter – Standard Filters. Scroll down to: HttpWebpageSearch.
Check the Capture Options
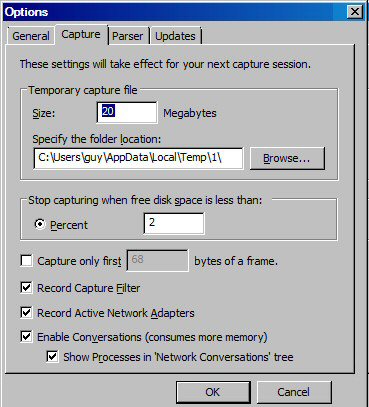
Before you begin, it’s worth checking the ‘Options’ in your Windows 7 network monitor.
Tools Menu –> Options –> Capture
- Temporary capture file: Size (of Buffer)
- Folder Location for the buffer
- Capture only first bytes of a frame. A useful setting to improve performance.
As the monitor driver (agent) receives network packets so it stores them in a temporary buffer.
Next the Windows 7 Network Monitor compares the frames in the buffer with the capture filter. Any frames which match the capture filter are shown in the GUI. The rest of the frames are discarded.
Start with Standard Filters
Begin by at the Filter menu, click on the Capture Filter –> Load Filter – Standard Filters. Now make your selection, for instance IPv4Addresses.
You will soon learn of how the filter works, but does take a tries to obtain the results that you want. Just ‘playing’ can result in confusion, what helps is a clear mission, for example you just want to capture IPv4 addresses.
Type your Filter in the dialog box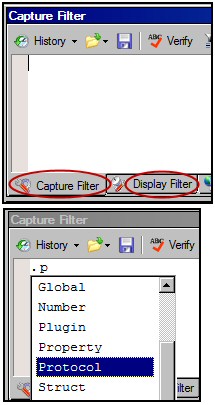
Once you have tested some of the Standard Filters, I suggest you try using the IntelliSense of the Capture Filter box. Begin by typing a period (.) also called the full stop. Now you should see the top level names. Type ‘p’ and IntelliSense kicks in again and displays Protocol.
You could repeat the method and thus append TCP. The result should look like: .Protocol.TCP.
An Alternative Filter Method
Another way of creating filters is to work from a frame that you have already captured. Focus on the Frame Summary screen, then right-click an interesting entry. Next select: ‘Add Source to Display Filter’ from the drop-down menu. The knack is to select the ‘Source’ column for your click, filtering on the ‘Time Offset’ column does not make sense.
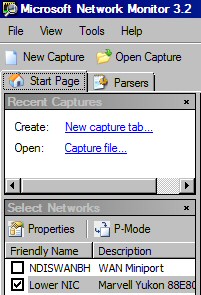
Save Captures
Save your capture to a file simply by clicking ‘Save As’ on the toolbar. A good option when you save is to select only those frames which match your filter criteria. Naturally you can revisit previous captures by using the Open Capture dialog box.
Copy Frames
At first the prospect of copying frames did not seem very useful. The benefit comes when you copy a bunch of frames into Excel and then employ the spreadsheet’s math functions on the numeric fields. For example, calculating average response times.
Other uses of Copy include pasting the data into an email, and thus alerting other people of rogue processes the network.
Quick Capture Statistics
When capturing, the Windows 7 Network Monitor shows stats in the status bar at the bottom of the window:
- Displayed: The number of frames in the Frame Summary window.
- Dropped: The number of dropped frames.
- Captured: The total number of frames captured for a particular session.
![]()
Real-time Network Traffic Analysis – An Alternative to the Windows 7 Network Monitor

Many network managers give up with Windows 7’s network monitor. This is because they find collecting network traffic tedious, even if they manage to capture network conversations they find it difficult to make sense of the data.
If you get frustrated with Microsoft’s monitor, then try an alternative that takes the pain out of network traffic analysis. One advantage of this NetFlow Analyzer is that you can see a graphic of server availability instantly. Download your copy of SolarWinds’free Real-time NetFlow Analyzer.
♠
Enable Network Conversations
 Isolating conversations is a new feature of the Microsoft Network Monitor 3.3. This feature groups captures, and thus you can see more easily what is happening. The key point is to select the conversation from the tree on the left of the Network Monitor GUI, you can expand the tree to see individual processes.
Using this technique you could research unknown processes; one day you may discover that a rogue program that has infected your network. See also this network traffic analyzer.
Advanced Topic – How Network Monitor Parses Headers
The Windows 7 Network Monitor relies on two processes, firstly, capturing network frames. Secondly, a parsing engine which analyses the raw bytes of data and displays the results in a GUI. 
Once you have mastered the basics of capturing and filtering the network traffic, you may wish to investigate a whole new world of parsers. On the one hand parsers teach you how packet collection works ‘under the covers’, on the other hand, parsers are the gateway to a new level of controlling the way raw data is displayed in the monitor.
Getting Started
Click the ‘Parsers’ tab next to the Start Page.
Begin with an overview of all the available parsers. As you gain in confidence and experience, you could try modifying and saving the new Parsers. However, to my mind being an expert at creating parsers is a different and higher level skill from troubleshooting data.
See also SolarWinds free Real-time Netflow Analyser »
7 Tips for the Windows 7 Network Monitor
- Set ‘Frame Truncation’ to reduce your buffer size improve collection performance (Tools Menu, Options).
- Lookout for context sensitive menu variations.
- Copy and paste frames of your capture into Excel, then calculate totals.
- Try creating an Alias for IP addresses.
- Check out the Filters –> Color Filters.
- Get out of jail ‘Restore’
View menu –> ‘Window’ –> ‘Restore Default Layout’. - It’s worth checking the version number of the Network Monitor in the Control Panel. Go to Programs and Features, right-click on the Columns, choose ‘More’ and add the ‘Version’ tab.
The Windows 7 Network Monitor has a Command-line Tool Called Nmcap.exe
If you prefer the command-line, you can control the Network Monitor via the Nmcap executable.
For example: nmcap /network * /capture /file guycap.cap
You can even use the same filters at the command line as seen in the Capture Filter GUI. Once you have created your filter in the GUI you could copy and paste it into the Nmcap command-line. The command-line syntax is /Frame ‘Your Filter’.
If you like this page then please share it with your friends
Microsoft Windows 7 Network Topics
• Windows 7 • Windows 7 Network Adapter Connection • Windows 7 Network Monitor
• Windows 8 Network Location • Windows 7 Private Network • Windows 7 Shutdown
• Windows 8 Configuration • Windows 8 Metro UI • Windows 8 Wireless • Network Performance Monitor