The term “network latency” refers to the time it takes for a packet to get from one point on the network to another. The unit of measure for this metric is milliseconds. So, reducing latency means to speed up the transit time across the network.
>>>Jump to network management tools for improving latency<<<
For testing purposes, it is usual to measure latency as the time it takes for a packet to get to one point and then back again to the monitoring node. This is called the Round Trip Time (RTT). Another measurement is called Time To First Byte (TTFB). This expresses the time difference between the packet leaving the sender and arriving at the receiver. It is only possible to measure this if the monitoring software includes a data collector at the destination. Round-trip time is the most frequently used of these two methods.
Contents
What causes network latency?
A network is made up of many components and traffic bottlenecks at any one of them can increase latency. The points of the contention that influence the latency are:
- Sender capacity
- Transmission media capacity
- Network device capacity
- Receiver capacity
- System efficiency
The term “capacity” refers to the speed at which the element can process data when accounting for its full potential and current load. You need to look at the capabilities of the sending and receiving devices, the network cable, and the switches, bridges, and routers that the data passes through in order to get from the sender to the receiver.
System efficiency covers all processing elements in the network. In the case of devices, software should be taken into consideration as well as hardware. The architecture of servers is also an influence – multithread systems can handle processes in parallel and improve the latency per request when a load of multiple requests is applied to the service.
You also need to examine packet loss when measuring latency because lost packets provoke retransmission thereby increasing the time that the receiver has to wait.
The efficiency of transmission settings is also a factor. If one relaying device isn’t capable of handling the size of packets in transmission, it will split that packet up for reassembly at the receiving node. The division and reassembly process takes time and increases latency. The maximum packet length that a network interface can handle is called the “Maximum Transmission Unit” (MTU) and is expressed in bytes.
Identifying network congestion
Congestion is a major factor that increases network latency and it is also the main cause of packet loss. The term “congestion” means that the network is overloaded. When this occurs, it is usual for demand to exceed available capacity in just one or two points on the network.
A point of congestion is called a “bottleneck.” This is a node on the network that regularly receives more traffic than it can cope with. Congestion usually occurs on network devices. If too many requests arrive at a device, that device will put later requests into a queue while it clears the packets that it is currently processing. This causes a delay in the journey of those packets. If the traffic volume overwhelms the queue capacity of the switch, they won’t get into the queue and so will just be ignored and dropped.
Be aware that fixing a bottleneck in one area of the network may cause new bottlenecks to develop in other areas. It is very common that the traffic slowing caused by one node keeps other devices from getting overloaded. So, once the capacity is increased at those devices, the increased throughput may pass more traffic through to downstream devices than they can cope with.
Measuring latency with Ping and Traceroute
The most common method used to measure latency on a network is called “Ping”. This is a free utility that is built into all network interface software, so if your computer is capable of connecting to a network, it already has Ping.
The Ping utility reports on the round-trip time from the sender to a destination and back. This will give you the bare latency time and also report on the packet loss. Another useful tool is Traceroute. This reports on all of the nodes that a packet passes through in order to reach the destination. It will also tell you the number of milliseconds that the transmission took on each hop. Neither of these tools will give you the maximum transmission unit (MTU) of each device.
Getting a report on the MTU of a device through a tool is difficult. The closest tool available for this task is Ping, which you can issue with the -l and -f options, progressively increasing the packet size written in the -l option until you get an error back. In short, the quickest way of discovering MTU settings is to just log in to the management dashboard of each device and check its settings.
Network bandwidth and throughput capacity planning
A primary source of high latency is ‘lack of capacity’ on each device on the network along with the network cable itself. The maximum network traffic capacity is called the “bandwidth.” The amount of traffic that passes through a device at any moment is called the “throughput.” You need the network bandwidth to be higher than its throughput.
Unfortunately, the maximum bandwidth of your network is restricted to the lowest potential of all of the devices in a path. So, if your network includes a range of devices that have different bandwidths, the available bandwidth from point A to point B may be different to the available bandwidth from point C to point D because different devices with different bandwidths are included in each path.
Varying bandwidth provision is not necessarily a bad thing. Every network has some segments that have high demand, while others have low demand. Buying high-capacity equipment increases costs, so varying provision is a good cost-controlling strategy. However, you need to know the throughput expected on each link in your network in order to provision bandwidth correctly.
All networks can expect a natural growth in traffic due to increased activity in the business. This is a trend throughput expansion rate and should be added on to your bandwidth requirements. New demands on the network also need to be catered to. However, these cannot be defined until a new requirement is specified. Factors that will increase throughput include extra user devices connected to the network, new working practices, and new applications. This form of extra throughput cannot be included in regular capacity planning, but needs to be carried out as part of the project to introduce the new requirement.
Administration and management tasks for improving latency
There are a number of administration and management tasks that you can undertake in order to improve latency. These admin exercises cost nothing to implement and just require you to change the settings on network devices or reorganize the network.
Coordinate MTU
The first of these is to coordinate the MTU on your network devices. Although some network interfaces operating on your network may have the capability to send out very large packets, setting the MTU to this maximum capability won’t help you. Determine the MTU potential of each device. Set the MTU of the device that has the shortest packet processing capability to its maximum value and then set the MTU on all devices to that length.
Subnetting
You need to plan bandwidth to suit different levels of traffic in each physical area of your network. Simply reorganizing your bridges and switches so that endpoints that communicate most with each other are on the same segment will greatly reduce traffic on the wider network. For example, don’t allocate devices to switches by type, allocate them by location.
A lot of the traffic in a company division will be internal to that division and communications with a printer may account for a large percentage of traffic generated by that group of users. Therefore, connect the local printer to the same switch as the user devices that will send traffic to it.
It is a common best practice to match the logical structure of the network to its physical topology. So, break up your available address space and allocate sections to the devices connected to each switch. This process is called “subnetting.” You need to organize different address pools so that they are appropriate to the number of devices connected to the network segment that the address pool serves.
You don’t need to give each segment the same number of available addresses. Once you implement subnetting, you also need to guard against the same address being allocated to two devices. This creates address conflict. Subnetting can reduce the amount of traffic that crosses the wider network. However, the strategy needs to be managed and so you will need to use an IP Address Manager (IPAM). This suite of tools will also help you to manage a “bring your own device”, or BYOD, policy and it will improve your network security by identifying rogue devices connected to the network.
See also: Best IPAM Tools
Vary bandwidth
The chances are that you already have cable and network devices of different capacities on your network. However, after subnetting, you may find that you have more bandwidth than you need in some areas and not enough capacity in others. Once you have reorganized your network topology, you need to measure the available bandwidth and throughput on each link in your network.
The easiest way to monitor all of the load on all of your devices from one central point is to use a bandwidth analyzer. A bandwidth analizer will show you live network traffic throughput so that you can check for bottlenecks and overloaded segments. A bandwidth analyzer can communicate with your network devices to sample network traffic which can be stored on the central monitoring computer for analysis of historic data.
See also: Best Bandwidth Analysis Tools
Employ traffic shaping
Once you have a record of traffic patterns, you can engage in traffic shaping to help reduce bottlenecks and lower bandwidth requirements. With an unlimited budget, you could spend a lot of money working out the peak throughput and buying bandwidth to cater to that. However, traffic shaping strategies can help you to squeeze extra performance out of lower bandwidth and improve latency without spending a lot of money.
You should certainly implement queuing on your network devices even if you don’t want to ever let any traffic wait. Queuing is a backstop strategy that will prevent packet loss in times of heavy traffic or if a network device is below its top performance.
If you employ audiovisual applications in your company, this traffic needs to be prioritized because latency in interactive or streaming applications impairs the performance of the application, whereas the email system can run a little slower without anyone noticing. Traffic prioritization is implemented through queuing. Look into strategies such as class-based Quality of Service (QoS). This tags traffic into priority classes by application type. If throughput is below bandwidth capacity, then all traffic will travel at optimal speed. If the capacity of one of your devices is being reached, less important traffic gets queued to allow sufficient spare capacity for audiovisual traffic to pass through unhindered.
Implement load balancing
If you have a large network, the chances are that there are many paths from one end of the network to the other. This is path redundancy and it won’t apply to all links in the network. However, the main trunk routes will probably offer alternative paths.
Use a load balancer to monitor traffic on each segment of your network. If the traffic on one segment passes a warning threshold, the load balancer will reroute the traffic that it can divert onto an alternative path. This avoids one node getting overloaded while other devices are under capacity.
Monitor network devices
Even if you have your network capacity set so all of your traffic can flow at its maximum speed, you will occasionally experience performance problems with your network devices. So you need to install a network device monitor to ensure that any warning conditions get acted on quickly to head off outright failure.
All network devices include an implementation of the Simple Network Management Protocol (SNMP) in their operating systems. SNMP requires two elements: a device agent to gather information and send it and a manager to poll agents and collate status data.
You already have SNMP agents available on your network devices. You just have to switch them on. You also need to install a manager to collect the information held by the device agents. The network device monitor is that managing element.
Using network management tools
In order to stay on top of network performance and get latency down to optimal levels, you need to use investigative, analytical, and monitoring tools.
Fortunately, the market for networking tools is very well-supplied and you can even find some tools for free. As you can see from the task descriptions above, you will need a number of tools in order to improve the latency on your network.
You already have Ping and Traceroute available to you, but there are network management tools out there that integrate these two utilities and enable you to gather, store and reuse the information that they provide. In addition to these two utilities, you will need the following tools:
- Network performance monitor
- Network traffic analyser
- Subnet calculator
- IP address manager
Network management tools for latency
Some of the best network monitoring tools providers produce bundles of utilities that will fulfill all of your requirements.
Here is our list of the best network management tools:
- SolarWinds Network Bandwidth Analyzer Pack (FREE TRIAL)
- SolarWinds Engineer’s Toolset (FREE TRIAL)
- Paessler PRTG Network Monitor (FREE TRIAL)
- ManageEngine OpManager Plus
- Nagios XI
- WhatsUp Gold
You can read the details of these tools in the following sections.
1. SolarWinds Network Bandwidth Analyzer Pack (FREE TRIAL)

The Network Bandwidth Analyzer Pack includes two important tools: the SolarWinds Network Performance Monitor and the SolarWinds NetFlow Traffic Analyzer.
The SolarWinds Network Performance Monitor should be your first purchase when setting up your network monitoring system to improve latency. This is because the tool has an autodiscovery module that will trace all of your network devices and log them in an inventory, noting the bandwidth of each. The tool will also create a network map from this data.
The monitor acts as an SNMP manager and it will keep polling all of your devices for status reports. The autodiscovery procedure is actually the initial sweep with an SNMP request. Subsequent sweeps enable the Network Performance Monitor to spot when devices get added, moved, or removed. This means that both the device inventory and the network map get modified automatically. The SolarWinds Network Performance monitor includes a great visual tool, called NetPath that shows the path to a given destination with transfer times given for each hop. Each node in the map shows its status in color. The NetPath system is also able to extend out over the internet to remote sites and cloud services.
SNMP also includes an alert mechanism. This enables the device agent to notify the manager of problems without having to wait for a status report request.
One of the conditions that the agent will report on is throughput. It will also raise an alert when a throughput threshold is breached, so that you have time to take traffic-shaping measures before the device gets completely overloaded and starts rejecting packets.
The dashboard for the tool includes a number of pages, with the main screen showing live device status data. You will find the Quality of Experience utility on another page that contains a latency test facility to help you work out which links on your network need improvement.
Statuses on the main pages are color-coded so you can see which devices are in a Warning state or a Danger state. The network maps also color code the devices that it plots and the links between them, so you will instantly see overloaded segments.
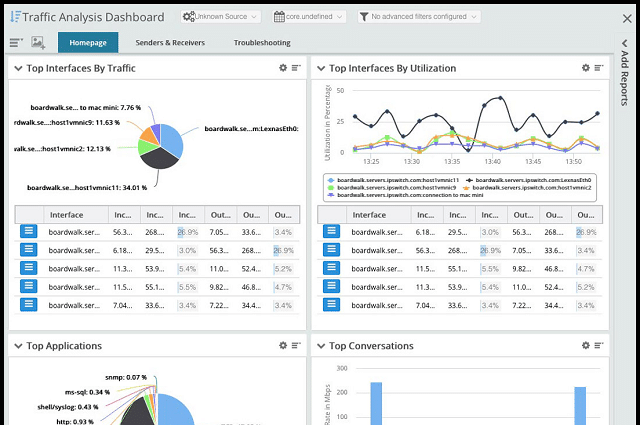
The NetFlow Traffic Analyser gives you deeper insights into your traffic flows and you will particularly need this module if you intend to implement traffic shaping. “NetFlow” is the name of a packet collecting and reporting tool that is built into Cisco routers. Although it is not an industry standard, many other device manufacturers add NetFlow capabilities to their switches and router, sometimes giving it a different name, such as J-Flow, which is a NetFlow clone operating on the devices produced by Juniper Networks.
Despite its name, the NetFlow Traffic Analyzer is not limited to using NetFlow. It also processes J-Flow messages, NetStream, which is used by Huawei devices, and the manufacturer-neutral sFlow and IPFIX systems. The Analyser will show this data live in its dashboard and also store it for later analysis. You really need to get a long sample of data gathered before beginning analysis because the throughput levels of passing data never tell the whole story.
You can implement and manage queue-based traffic shaping measures, such as class-based Quality of Service with the NetFlow Traffic Analyzer. If you run a voice system over the network, then you will also need the VLAN management capabilities of the tool. The analyzer looks into the headers of packets and so it is able to see the source and destination of each and also the ports that are involved in the connection. This knowledge enables the analyser to identify the protocols in operation, or even the applications that originated the traffic. By grouping all data produced by the NetFlow Traffic Analyzer, you will be able to identify all of the protocols and applications running traffic over your network and rank them in order of traffic magnitude.
The Network Bandwidth Analyzer Pack doesn’t include address management tools, such as a subnetting calculator or an IP address manager. However, SolarWinds produces an IP Address Manager, which includes a subnet calculator. All of these tools are written on a common platform, called Orion, so if you buy the SolarWinds IP Address Manager, it will integrate seamlessly with the Network Performance monitor and the NetFlow Traffic Analyzer.
The common platform of SolarWinds tools enables the provision of cross-modular utilities. PerfStack is one of these. This page in the dashboard shows you a stack of resources that supports each user application or gets triggered by a specific action. Each layer in the stack shows live statuses, so if you are having difficulties with one application, PerfStack will show you whether the problem really does lie with that application, or whether it is due to an error in a supporting service.
Another cross-modular feature is the wireless heat map, which shows the live signal footprint of your wireless transmitters.
Both the Network Performance Monitor and the NetFlow traffic Analyzer extend their capabilities out to the remote sites of WANs and to cloud services, so you can monitor a geographically-spread network and hybrid systems.
The SolarWinds Bandwidth Analyzer Pack runs on Windows Server environments. You can get the pack on a 30-day free trial. SolarWinds also produces a free Subnet Calculator.
2. SolarWinds Engineer’s Toolset (FREE TRIAL)
We have included a second SolarWinds bundle in this review because the Engineer’s Toolset is so packed with latency improvement tools that it is impossible to ignore. The Engineer’s Toolset includes more than 60 tools and a lot of those are exactly what you need to improve latency.
The Engineer’s Toolset can be integrated into the SolarWinds Network Performance Monitor. However, many of its tools duplicate NPM functionality, so you could perform your network management tasks easily with just the Toolset.
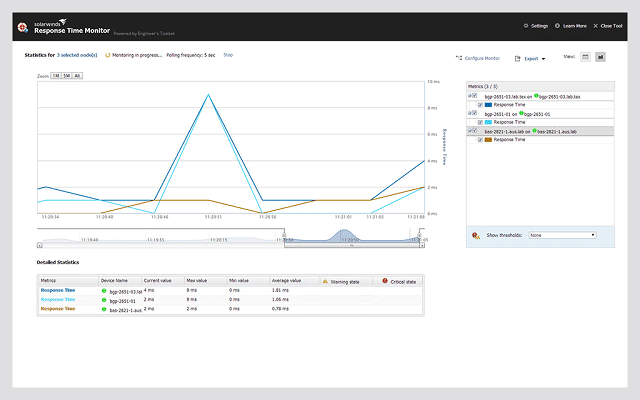
The bundle includes a network discovery tool that uses SNMP functionality in exactly the same way as the Network Performance Monitor. This SNMP usage continues through to a real-time network monitor. You will also find a Ping Sweep, a Visual Traceroute, a Response Time Monitor, an IP address manager, a subnet calculator, and a capacity planning toolkit that includes a stress tester.
The Engineer’s Toolset installs on Windows Server environments and you can access it on a 14-day free trial.
3. Paessler PRTG Network Monitor (FREE TRIAL)

Paessler PRTG Network Monitor is a three-in-one resource monitoring system. It monitors networks, servers, and applications. The network monitoring section of this tool includes network device monitoring and network traffic analysis.
PRTG installs on Windows Server and it is also available as cloud-based Software-as-a-Service (SaaS). The architecture of the tool is made up of sensors. There are a very large number of sensors in the system and you probably won’t activate them all. Paessler charges for the software in bands of sensor numbers. So, you buy the right to activate a quota of sensors. This enables you to tailor the system so it only implements the monitoring tools that you want. For example, in this instance, you only want to monitor the network in order to reduce latency, so you would just leave the server and application sensors switched off.
The heart of the network monitoring system is its SNMP sensor. You should activate that first of all to get your network monitoring system operating.
The first task that the SNMP sensor will perform is a sweep of the network to log all of the devices that you have connected to it. The dashboard software also plots a network map from this data. PRTG includes a number of topology viewing options which includes a zoomable real-world map, which would be of particular interest to those operating WANs – the PRTG monitoring capabilities extend out to remote sites and cloud services. PRTG can also monitor wireless network signals. Paessler invented its own network map style, which is called the “sunburst view.” This shows each application running on the network with the layers of its support stack, so this is a circular version of the SolarWinds PerfStack.
The statuses of each device are color-coded in the dashboard device list and also in all of the map layouts. The dashboard catches SNMP Trap messages to produce status alerts. These can be forwarded to you by email or SMS and you can even nominate different team members to receive those notifications according to source and severity of the alert.
You will definitely need to activate the Ping sensor. Although you can access Ping yourself at the command line, getting PRTG to use the service enables you to see the data in the dashboard and then you can also flow that data through to analysis modules. This is particularly useful for monitoring packet loss statistics within PRTG. You should also activate the traffic flow sensors in PRTG according to the make of equipment that you have running on your network. PRTG sensors can handle messages in NetFlow, IPFIX, J-Flow and sFlow formats.
There is also a separate proprietary packet sniffer sensor that will capture packets for you. Traffic metrics and packet headers collected through the sensors are shown live in the dashboard, but more usefully, they can also be stored to file for analysis. The analyzer allows you to filter records and aggregate them by application, endpoint addresses, or protocol/port number. The traffic analyser can track VLAN traffic, including VoIP connections passing over the data network. The monitor will log traffic flows that are tagged for the QoS, CBQoS, and IP SLA standards.
The PRTG dashboard is very well laid-out and includes plenty of data visualizations. The dashboard is customizable and you can create access accounts in user groups, allocating a different dashboard layout to each group. This makes task delegation a safe prospect because you can prevent junior team members from getting access to all controls. You can also create a view-only account for non-technical managers. The pre-written report formats that ship with PRTG help your communication efforts and you can create customized reports as well.
Unfortunately, Paessler doesn’t produce a subnet calculator or an IP Address Manager.
You can use Paessler PRTG for free for up to 100 sensors and Paessler offers a free trial of PRTG with unlimited sensors for 30 days.
4. ManageEngine OpManager Plus

ManageEngine tools are all available for Windows Server and for Linux. The company provides a stable of infrastructure management tools including a network device monitor, called OpManager. Another ManageEngine tool is its NetFlow Analyzer. In order to fully monitor your network to reduce latency, you can buy these two modules separately and they will integrate together because ManageEngine writes all of its tools on a common platform. However, if you opt for the OpManager Plus package, you get both of these tools included plus server and application monitoring capabilities.
OpManager Plus also includes another ManageEngine package, which is called OpUtils. This combines an IP Address Manager and a Switch Port Manager. The OpManager Plus bundle also includes a Network Configuration Manager. Rounding out this bundle of everything including the kitchen sink, OpManager Plus also includes server and application monitors and the Firewall Log Manager. The IPAM includes a subnet calculator.
After you install OpManager Plus, it will employ SNMP methods to gather a device inventory and draw up a network map. Maintenance of the device inventory is ongoing and it will be updated automatically when devices are added, moved, or retired. The map also gets updated automatically to reflect these inventory changes. OpManager Plus can also monitor entire WANs from a central location. It is able to integrate cloud service monitoring and wifi network monitoring.
The dashboard includes a range of map formats. You can filter the map to show just switches, or just routers. You can change the device labels to show the hostname, MAC address, or network IP address. There is also a zoomable world map view for WANs. When you zoom into a site shown on the map you get a detailed view of the network at that location. Other topology views include a server cabinet view and a server room layout plan.
All topology layouts include color coding for devices to show their statuses at a glance. The main screen of the dashboard lists the device inventory, which also has color coding for statuses. Each device record is a link through to a detailed status report, which shows the device’s bandwidth and current load.
Alert conditions are shown in a separate panel, which acts as a news feed. These alerts are also color-coded and you can get them forwarded to you as notifications by email or SMS. Alerts can be customized and can be based on traffic flow data as well as SNMP sources.
The traffic flow monitoring system in OpManager Plus can communicate with network devices via NetFlow, IPFIX, J-Flow, NetStream, sFlow, and AppFlow.
Data from these sources is shown live in the dashboard and you can also store them to files for historical analysis.
OpManager Plus includes a Ping function that reports live on packet loss and round-trip times for each link on your network. This data can also be stored for analysis. OpManager Plus also has the ability to implement IP SLA. This measures jitter, latency, Mean Opinion Score (MOS), and packet loss. The bandwidth analyzer will also report on round-trip time on connections to remote facilities. Live data gathered by these techniques is shown in the dashboard and can be filtered by application or port number/protocol activity.
The OpManager Plus is able use Cisco’s Network Based Application Recognition (NBAR) system to segment traffic data. It is also capable of implementing and monitoring traffic shaping and VLAN tagging methods, including Quality of Service (QoS) and Class-Based QoS for queue management.
The dashboard includes a Capacity Planning module that shows bandwidth utilization graphs over time. These can work on live data, or interpret historical data read from a file. The monitor can be set to collect data for analysis around the clock as a background task so you will be able to see out-of-hours activity as well as office hours throughput. That will enable you to shift scheduled tasks to off-peak times and free up bandwidth for business-critical live applications.
The dashboard has a lot of attractive color-coded data visualizations, which can also be included in reports. You can schedule reports to run automatically and get sent out by email to concerned parties. This is a great way to keep non-technical managers informed of network performance. The report engine also allows you to create your own formats. The dashboard can be customized and it is protected by user account authentication. This allows you to create different user groups and offer reduced views on data and limited controls for access by different team members. The dashboard can also be accessed remotely from mobile devices.
The basic OpManager package of ManageEngine can be used for free to monitor up to 10 devices. OpManager, OpManager Plus, and OpUtils are all available on a 30-day free trial.
5. Nagios XI

The central processing engine of Nagios XI is a free open source project, called Nagios Core. That free product is just as comprehensive as the backend of Nagios XI, except that the front end that it ships with is not very good and you won’t get any professional support for it. If you want to opt for Nagios Core, you can seek advice from the user community which is very active on the Nagios forum. That community is a great source of free extensions to Nagios which also work for Nagios XI.
Nagios is very widely-implemented and a number of other infrastructure monitoring tools are just adaptations of Nagios Core. All of those variations are compatible with the community-written extensions. So, the Nagios option is really a category of network monitoring tools. In this review, though, we will just focus on Nagios XI.
Nagios XI has a slick front end that features planning utilities as well as monitoring functions. The basic Nagios XI covers networks and servers, but you can extend it. Another advantage of the Nagios XI option is that it comes with a support contract.
You need to have a Linux server to run the back end of Nagios. Despite that host requirement, the system can monitor activities arising from computers running other operating systems, including Windows. It is also capable of centralizing the multi-site installations of WANs, it can monitor cloud services and it will also integrate monitoring of wireless networks. Specifically, you will need RHEL or CentOS Linux to run Nagios XL. You can get the front-end onto Windows via a VMware or Hyper-V virtual machine.
Nagios doesn’t use SNMP. It has its own device messaging system instead. However, to all intents and purposes, it is exactly the same as SNMP. The device monitor will discover all equipment connected to the network, log it, and map it. The network monitor continues to monitor devices for statuses and device agents generate status alerts in the same way the SNMP agents do. If you would really rather have SNMP reporting, you can still use Nagios, because there is a community-created SNMP plug-in for the monitor.
Statuses are shown live on the dashboard and highlighted in colors on the topology map. The inventory and map get updated automatically when devices are added, moved, or taken away. Nagios collects data on device capacity, bandwidth usage, and packet loss per link.
As well as viewing live data in the dashboard, you can get it stored to file for analysis. The capacity planning module of Nagios XI includes a trend graph that interpolates historic data to show possible future demand. A really nice feature of Nagios is a replay feature, which gets network traffic records run out as an animation on the network map. Nagios XI is available in two editions and the capacity planning module is only included with the more expensive plan. However, there are capacity planning plugins available from the user community for free.
The dashboard is made up of widgets, so you can set up your own screens by adding different features. You can also create several different user account-protected dashboards to enable you to share access with specialist team members. Widgets include the display of traffic throughput rates, packet loss, device processor, and memory utilization. You can set threshold levels on these metrics and trigger alerts whenever they are breached.
Nagios ships with pre-written reports that can also include some of the great data visualizations that appear as dashboard widgets, such as graphs and pie charts. Again, the user community can come to your aid, providing bundles of report formats, or you could write your own.
Nagios XI doesn’t include a subnet calculator or an IPAM. You can get Nagios XI on a 60-day free trial.
6. WhatsUp Gold
WhatsUp Gold, by Ipswitch is a network device monitor that can be extended. For network latency monitoring you will need all of the facilities of the base utility, plus the Network Traffic Analysis add-on. All Ipswitch products are written to run on Windows Server.
The central WhatsUp Gold monitor operates with SNMP functions so it will discover all of your network devices and then keep polling them for statuses. Like the other tools on this list, WhatsUp gold compiles a device inventory from the SNMP agent responses and displays these in the dashboard. Each record in the main screen acts as a link to a status page for that device. You can see the device’s bandwidth potential and its current utilization.
The dashboard also includes a network topology map. Both the inventory and the map get updated automatically when SNMP polling discovers new devices. Also, the map and the inventory adjust in the event of devices being moved or removed. Both the inventory and the network map show device statuses in color – green is good, red is bad, and yellow is a warning. Links on the map also show color-coded statuses.
The Network Traffic Analysis add-on communicates with devices through the NetFlow, NetFlow Lite, IPFIX, J-Flow, sFlow, and QUIC messaging systems
All of the packet traffic data and packet headers gathered by the Network Traffic Analyzer are shown in the dashboard and can also be stored for capacity planning and analysis. The data viewer is able to sort, group, and filter records to give you different perspectives on traffic including an ordered list of the largest traffic sources. You can also show traffic flows per device, enabling you to watch throughput surges as they pass from device to device. The Network Traffic Analyzer recognizes and manages CBQoS and NBAR tagging.
The WhatsUp Gold package includes a reporting module with a library of pre-written report formats. A key report set that you will use a lot for latency analysis shows the top traffic generators listed by software package, application, protocol, or source IP address. These reports can be customized to enable you to communicate your latency improvement strategy. The dashboard assists condition comprehension through visualizations that include line graphs, pie charts, and dials.
Ipswitch produces a standalone IP address manager which is available on a 30-day free trial. Despite the WhatsUp name, it isn’t possible to integrate this tool into WhatsUp Gold as an add-on. The IPAM includes a subnet calculator.
Ipswitch offers a 30-day free trial of WhatsUp Gold, the Network Traffic Analysis add-on, and WhatsUp IP Address Manager. Ipswitch also offers a useful graphical version of Traceroute for no charge. This is the Free Visual Traceroute.
How to improve network latency
The issue of network latency can be too complicated to solve manually. There are too many factors with just about every piece of equipment on your network that influence latency for you to keep track of everything. The tools listed in this guide are essential to successful application delivery.
This guide focused on techniques to investigate and reduce latency on LANs. You will need to deploy different solutions to speed up the delivery of web content over the web. Communications with external correspondents also engender negotiation of firewalls and authentication servers.
There are a lot of network latency improvement tools on the market at the moment and very few of them are not worth consideration. That is an embarrassment of riches, which has a downside – it takes too long to investigate all of them. However, if you just focus your search on the six options that we have explained in this guide, you will be experiencing the best of a bunch of good options.
Fortunately, all of the tools in this list offer free trials or permanently free versions, so you can give any or all of them a try without risking any money. So, pick all of the tools in this guide that work with your server’s operating system and try them out. You will arrive at a choice that has a look and feel that works well for you.
Do you have any recommendations for network latency tools that aren’t on our list? Have you tried any tools that turned out to be useless? What is your preferred method for speeding up data and application delivery over your network? Leave a message in the Comments section below and share your experience with the community.