
Traceroute is a very useful tool that is available on any connected device. The utility is based on the Internet Control Message Protocol (ICMP), so it employs fundamental error reporting mechanisms to work out the most likely path a connection will take to get to a stated destination.
Each router makes its own decision on which neighbor it should forward packets to. The router references its routing table to work out where a packet should go next. Those routing tables are updated constantly, so a traceroute issued after a connection has been made from the same computer might not necessarily take the same route. However, the likelihood that a route has changed in a few minutes is not that great, so Traceroute can give you a good idea of which routers the packets of your last connection passed through.
Contents
- 1 Traceroute format
- 2 Traceroute on Windows
- 3 Traceroute on Linux
- 4 Traceroute on Mac OS
- 5 Traceroute output
- 6 Traceroute tools
- 7 1. SolarWinds Traceroute with Engineer’s Toolset (FREE TRIAL)
- 8 2. Paessler Traceroute Hop Count Sensor with PRTG (FREE TRIAL)
- 9 3. SolarWinds Traceroute-NG (FREE TOOL)
- 10 4. VisualRoute
- 11 5. Open Visual Traceroute
- 12 6. Ipswitch Free Visual Traceroute
- 13 7. Free Ping and Traceroute Tool
- 14 Using Traceroute
>>>Jump to the list of traceroute tools<<<
Traceroute format
The basic command line Traceroute is pretty much the same whichever operating system you use it on. One of the few variations is the name of the command. On Unix, Linux, and Mac OS, the command is traceroute, but on Windows, it is tracert. Another difference between these operating system implementations lies in the parameters that are available to the command.
Traceroute on Windows
On Windows, you need to open a Command Prompt window in order to use the command line tracert utility. On Windows 10, type cmd into the search box next to the Start button and select the top entry in the results list.

Here is the schema for the tracert command:
tracert [-d] [-h maximum_hops] [-j host-list] [-w timeout]
        [-R] [-S srcaddr] [-4] [-6] target_name
Here is what those parameters mean:
| Paramater | Variable | Description |
|---|---|---|
| -d | Do not resolve addresses to hostnames. | |
| -h | maximum_hops | Maximum number of hops to search for target |
| -j | host-list | Loose source route along host-list (IPv4-only) |
| -w | timeout | Wait timeout (milliseconds) for each reply |
| -R | Trace round-trip path (IPv6-only) | |
| -S | srcaddr | Source address to use (IPv6-only) |
| -4 | Force using IPv4 | |
| -6 | Force using IPv6 |
So, just using the basic command, you only need to enter a destination address. You don’t need to look up the IP address of the destination because tracert will resolve a domain name if you type that in. If you just enter the command without any destination, tracert will give you the guide on the usage of the command.
Traceroute on Linux
On Linux, you really do use traceroute because the command to launch it is the same as the utility’s name. There are a lot more options with the Linux version than with the Windows tracert. To get a list of options for the command, use traceroute –help. Here are the parameters for the command:
traceroute [-46dFITUnreAV] [-f first_ttl] [-g gate,...]
            [-i device] [-m max_ttl] [-p port] [-s src_addr]
            [-q nqueries] [-N squeries] [-t tos]
            [-l flow_label] [-w waittimes] [-z sendwait] [-UL] [-D]
            [-P proto] [--sport=port] [-M method] [-O mod_options]
            [--mtu] [--back]
            host [packet_len]
Here’s what those options mean:
| Paramater | Variable | Description |
|---|---|---|
| -4 | Force IPv4 | |
| -6 | Force IPv6 | |
| -I | Use ICMP ECHO | |
| --icmp | As above | |
| -T | Use TCP SYN for probes | |
| --tcp | As above | |
| -d | Enable socket level debugging (when the Linux kernel supports it) | |
| --debug | As above | |
| -F | Do not fragment probe packets | |
| --dont-fragment | As above | |
| -f | first_ttl | Time to live starting point. The default is 1 |
| --first= | first_ttl | As above |
| -g | gateway | Route through the specified gateway (disabled on most routers for security) |
| --gateway= | gateway | As above |
| -i | interface | The interface through which traceroute should send packets |
| --interface= | interface | As above |
| -m | max_ttl | The maximum number of hops (time-to-live value). The default is 30 |
| --max-hops= | max_ttl | As above |
| -N | squeries | The number of packets sent out simultaneously. The Default is 16. |
| --sim-queries= | squeries | As above |
| -n | Don’t map IP addresses to host names | |
| -p | port | The destination port base. Increments for each probe (except for TCP) |
| --port= | port | As above |
| -t | tos | Set Type of Service (TOS) and Precedence in IPv4. Set Traffic Control in IPv6 |
| --tos= | tos | As above |
| -l | flow_label | Use specified flow_label for IPv6 packets |
| --flowlabel= | flow_label | As above |
| -w | max[,here,near] | Determines how long to wait for a response to a probe |
| --wait= | max[,here,near] | As above |
| -q | nqueries | The number of probe packets per hop. The default is 3 |
| --queries= | nqueries | As above |
| -r | Bypass the routing tables, send straight to a host on an attached network | |
| -s | source_addr | An alternative source address. Must be the address of one of the interfaces |
| --source= | source_addr | As above |
| -z | sendwait | Minimal time interval between probes The default is 0, max is 10 |
| --sendwait= | sendwait | As above |
| -e | Show ICMP extensions (rfc4884) | |
| --extensions | As above | |
| -A | Perform AS path lookups in routing registries and print results | |
| --as-path-lookups | As above | |
| -V | Print the version and exit | |
| --version | As above | |
| --sport= | port | The source port to use |
| --fwmark= | mark | Set the firewall mark for outgoing packets |
| -M | method | Use specified method for traceroute: default (UDP), tcp, or icmp |
| --module= | name | As above |
| -O | option | Method-specific options, separated by commas. List options with -O help. |
| --options= | options | As above |
| -U | Use UDP to static destination port. Default is 53 (DNS) | |
| --udp | As above | |
| -UL | Use UDPLITE port for tracerouting. Default is 53 | |
| -D | Use DCCP requests for probes | |
| --dccp | As above | |
| -P | protocol | Use raw packet of specified protocol. Default protocol is 253 |
| --protocol= | protocol | As above |
| --mtu | Discover maximum transmission unit on the path. Implies -F -N 1 | |
| --back | Print the number of backward hops when different to the forward direction |
Traceroute is also available on Unix. The parameters on that version are not the same as with the Linux implementation.
Traceroute on Mac OS
The Mac OS implementation of Traceroute is the simplest of all. Like the Unix and Linux versions, the command on Mac OS is traceroute. This version only has one parameter, which is the host address. This can be in the form of a hostname (domain) or an IP address, eg:
traceroute google.comor
traceroute 172.217.16.174The command is the same in Mac OS X and macOS.
Traceroute output
The results from a Traceroute run are presented differently depending on the operating system.
On Windows the output looks like this:
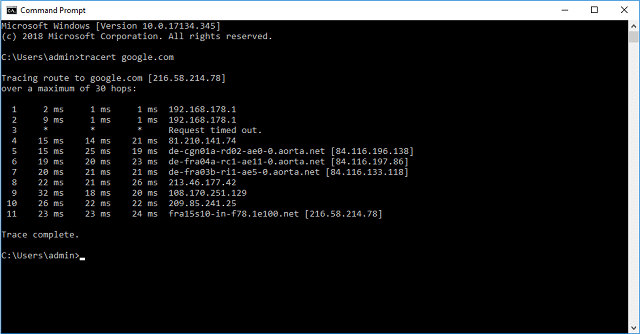
Unfortunately, the columns in the report don’t have headings. The first column is the hop number. This might not necessarily be to the next router. As you can see in the example, the first two entries are to the same router, which is the router of the network that the computer originating the command was connected to – that is, the default gateway.
The next three columns in the output are three attempts to contact that router and the time it took for a packet to be sent to that router and get an error message back (the round-trip time). The last column shows the hostname and the corresponding IP address or just an IP address.
You will notice on this output that the third entry didn’t work out. A failed report on one node on the path doesn’t stop the traceroute from continuing on to the next router in the path. This is because the failure, in this case, was a reporting problem and not an operational problem on the router, so the connection can still pass through the device even though Traceroute can’t provoke that router into replying.
The output format for Linux and Mac OS is slightly different to that shown here as the output of Windows. On these operating systems, Traceroute shows the hostname and IP address of the router before the roundtrip times of the three (by default) probes. The very first field in each record is the hop number, just like in the Windows output.
Traceroute tools
Many system tool developers have created interpretations of Traceroute with GUI interfaces for Windows, Mac OS, and the GNOME environments of Linux. Some great news about these is that many are free. In the next sections, you will learn about these.
Here is our list of the best Traceroute tools:
- SolarWinds Traceroute with Engineer’s Toolset (FREE TRIAL)
- Paessler Traceroute Hop Count Sensor with PRTG (FREE TRIAL)
- SolarWinds Traceroute NG (FREE TOOL)
- VisualRoute
- Open Visual Traceroute
- Ipswitch Free Visual Traceroute
- Free Ping and Traceroute Tool
These tools are explained in greater detail below.
1. SolarWinds Traceroute with Engineer’s Toolset (FREE TRIAL)

The SolarWinds Traceroute is part of the Engineer’s Toolset. This pack of useful sysadmin utilities provides all of the software that you need to manage a network.
The Traceroute module has a GUI front-end and is available for Windows. The execution method employs TCP packets to test routers. The operating procedures for the tool are very straightforward. You just have to enter a destination IP address or hostname in the only input field in the screen and then the results appear in tabulated format in the display panel, which fills up the rest of the window.
The output includes a couple of extra fields that aren’t usually included with Traceroute. These are the make and status of each router that the test runs through. These fields are not always populated because many router owners block SNMP messaging from external sources – those pieces of information are provided by a Simple Network Management Protocol query. You would stand a better chance of getting data in these fields if you use the tool to check routes on your own private network.
The Engineer’s Toolset is available for a 14-day free trial.
2. Paessler Traceroute Hop Count Sensor with PRTG (FREE TRIAL)

Paessler PRTG is a very large and comprehensive infrastructure monitoring tool. It covers all aspects of your system and the company ships the whole bundle no matter which modules you actually want to use. The system is made up of a collection of “sensors” and the price you pay for a license depends on how many sensors you activate, so you can tailor the monitor to just cover one aspect of your network. Traceroute Hop Count Sensor is one of the available sensors.
The results page shows each link on a separate page. You get to see the roundtrip time averaged over many runs with the minimum and maximum time for a group of probes up to the present time. The link between hops is maintained through a common parent tag.
Tagging is registered in a hierarchical structure with inheritance built in, so if you set up tags to mark connections, all of the hops in the connection will inherit the connection’s tag. This helps you group, aggregate, and sort data once you get Traceroute data into the data viewer. PRTG also includes a Ping sensor and packet capture sensors, and all of the different sensors will interact, so you can relate conditions discovered by one sensor with data collected by another.
The dashboard of PRTG is customizable and you can also set up custom alerts. That allows you to get notifications sent to you by email or SMS if the Traceroute sensor spots a slow connection. You can also set up triggers, so that would enable you to start sampling data flows if a delay is detected on a link.
The customizable dashboard enables you to create accounts with different views and controls for different team members. This will enable you to delegate tasks safely.
A great thing about Paessler PRTG is that you don’t have to pay for it if you only activate up to 100 sensors. So, if you just want to use its Traceroute, you can use it free of charge. You can also get a 30-day free trial of the full system. There is also a hosted version available. The on-site version installs on Windows Server.
3. SolarWinds Traceroute-NG (FREE TOOL)

SolarWinds Traceroute NG is a free standalone tool for Windows. However, it is run from the command line, much like the original Traceroute. A big difference between this implementation of Traceroute and the standard Windows tracert is that this utility operates in its own command line environment. This is a text-based utility and it doesn’t respond to the mouse.
Once the program has traced a route, it lists all of the routers in a table, which is neatly separated into delimited columns. The utility then continues to check response times for each router until you exit out of the display. The tool will alert you when rerouting causes the path to change.
You can choose between an ICMP trace or a TCP trace. Using a TCP connection gives you response times that better reflect real-world connections because you are unlikely to connect over the internet without using security, which requires TCP. Some nice extras in the results include packet loss, which you would normally need to run Ping to get. Records can be written to log files.
This tool would be suitable for checking private networks and also internet connections. SolarWinds have made Traceroute NG available as a free tool.
4. VisualRoute
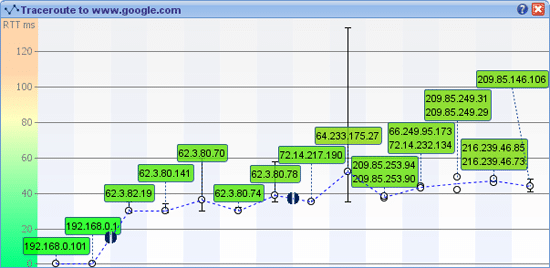
VisualRoute has a very nice interface that displays several different panels of graphical data on routes all at the same time. These graphs enable instant condition recognition, so you won’t have to wade through difficult-to-read data records in order to spot a problem.
This tool installs on Windows 7 and 8 and also on Mac OS. There are several editions of the package, which include VisualRoute LITE. That version is free to use for personal usage, but businesses have to pay for it. With the regular plans, you have to buy a license that covers a number of users and you can also opt to add in a one-year maintenance contract. Traceroute lies at the heart of the VisualRoute data collection procedures. It also integrates Ping. The dashboard enables you to see the performance of a connection and then drill-down to details on individual links. The dashboard is also available as an Internet Explorer or Firefox add-on.
The combination of Traceroute, Ping, and DNS lookups gives you a complete picture of the statuses of your connections. You can store data for analysis and also adjust the settings of each data representation to get larger views of each graph.
A reverse trace feature, which requires the installation of agents on destination servers will show your connections from the remote server’s perspective. Information gathered by the tool shows packet loss and return trip times both end-to-end and link-by-link for any nominated connection. Traceroute can be set to run constantly to your most important connection destinations; that will give you live updates on the states of all the routers in the paths that you need to keep working efficiently.
VisualRoute has a lot of nice features to explore and you can get it on a 15-day free trial.
5. Open Visual Traceroute

Open Visual Traceroute is another little-known free Traceroute implementation that you should try out. This tool has a GUI front-end and it installs on Windows 7, 8, and 10, Mac OS, and Ubuntu and OpenSUSE Linux.
The front-end features some great route representations that are overlaid on real-world maps. This gives a very sophisticated display, which would look great in presentations to the boardroom or clients. While the 3D maps look really good, they can use up a lot of processing power, so the Open Visual Traceroute package also includes a series of 2D map views for lighter processing. The software is open source, so you can read through the code to check its security features and even adjust the code to suit your implementation.
The traceroute data is listed in one panel of the dashboard, while another panel shows how each link contributes to the total round trip time of the connection.
Other tools in this package include a packet sniffer and a Whois function that will give you ownership details for the hosts that you encounter during your Traceroute sessions.
This is a great tool that is well worth investigating and one of the few network utilities around that can run on Macs.
6. Ipswitch Free Visual Traceroute

Ipswitch produces a network monitoring tool, called WhatsUp Gold. You don’t need to have that system installed in order to use the Free Visual Traceroute, because it is a standalone system.
This utility runs Traceroute queries on demand through a graphical interface. You can choose to run the Traceroute probe with ICMP, UDP, or TCP. Other query features allow you to specify the source and destination ports for the probe and you can also set the probe packet length and the response timeout tolerance.
The dashboard displays Traceroute results as a table and also as a graph. That graph shows the round-trip time of each router in the path, so you can quickly identify which node is causing delays. As well as running on demand, you can set the Free Visual Traceroute probe to run constantly, providing updated live data.
This is an attractive and efficient network monitoring tool that installs on Windows.
7. Free Ping and Traceroute Tool

ManageEngine is another major producer of infrastructure management. Its Free Ping and Traceroute Tool combines the facilities of these two well-known network administration commands to bring you insights into your network and connections across the internet. This free tool can be installed on Windows or on Linux.
The base display in the GUI dashboard shows the Traceroute output in a table. For each hop, you will see probes that timed out and the round-trip time. You will also get reports on the end-to-end transmission speed of the link.
You can drill down on reach router record and launch a Ping session for it, monitoring the performance of that device in greater detail. This lightweight free tool gives you a fast and useful service for troubleshooting the quality of your connections.
Using Traceroute
Give the command line version of Traceroute a try in order to familiarize yourself with the basic functions of this handy tool. Once you are comfortable with the utilities operating methods, you will be able to look for more sophisticated solutions, such as the GUI tools listed in this guide.
Tools that combine the Traceroute utility with other services, such as Ping and SNMP monitoring, are very useful and form basic network management tools.
Do you have a favorite Traceroute utility? Leave a message in the Comments section below to share your experiences with the community.


Like!! Thank you for publishing this awesome article.
Great article! We will be linking to this great post on our website.
Keep up the good writing.