
As networks grow larger every year it has become ever more important for administrators to use network management tools to keep track of day to day events. From managing threats to checking if the equipment is working correctly, the quantity of data that must be monitored on an enterprise network is incomprehensible without network management software. To know how well your network is performing, you need a tool that cuts through the white noise.
Network monitoring software has been designed with the purpose of displaying your usage data and infrastructure health in a format that is easy to understand. Many products provide you with real-time data on your network infrastructure and its performance. High-quality programs will transfer this straight into graphs and other visual displays that are easy to understand.
For instance, a tool like SolarWinds Network Performance Monitor takes your real-time usage data and converts it into a graph where it can be analyzed. This helps to make sure that you don’t miss any areas of poor network health. In this article, we’ve provided you with a list of the best network management software on the market.
Here is our list of the best network management tools:
- SolarWinds Network Performance Monitor (FREE TRIAL)
- Paessler PRTG (FREE TRIAL)
- ManageEngine OpManager
- Zabbix
- Nagios XI
- Icinga
- Spiceworks Network Monitor
- GFI LanGuard
- WhatsUp Gold
1. SolarWinds Network Performance Monitor (FREE TRIAL)
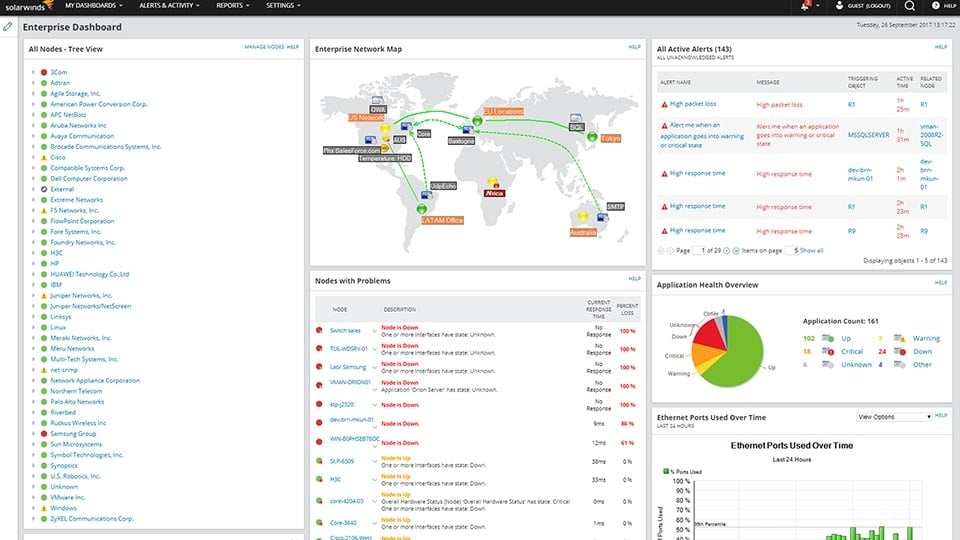
At the top of our list we have SolarWinds Network Performance Monitor. Network Performance Monitor uses SNMP to scan your network to verify the status of your network infrastructure. It can tell you if a device has gone down or if its utilization has exceeded a critical threshold. In short, it helps you to take a microscope to your network connection.
SolarWinds Network Performance Monitor is run through a dashboard. The customizable dashboard is the central hub from which you monitor your network and comb through your data for insights. On this screen you can view all of your data displayed through the use of graphs and pie charts. These are precise enough for you to scan through for vulnerabilities very quickly.
Throughout the user interface, services that have gone down are denoted by the color red (those in green are still active). A run-down of all devices that are compromised can be found in the suitably named Nodes with Problems window. This acts as one of the central places for you to troubleshoot your network. If a device is experiencing poor performance, you’ll find it here.
In the event that you’re unable to deal with a pressing issue (or simply miss something!), the alerts system will notify you via email or SMS. Alerts help to keep you in the loop even when you’re not at your desk. This alleviates the pressure of having to monitor your network manually.
Both SME’s and large enterprises should consider SolarWinds Network Performance Monitor on account of its ease of use. There isn’t much configuration that needs to be done, and the overall design is minimalist enough to allow you to see what you’re looking for without trawling through the navigation tree. Network Performance Monitor is available from $2,895 (£2,187) and upwards. There is also a 30-day free trial which can be downloaded from this link here.
2. Paessler PRTG (FREE TRIAL)
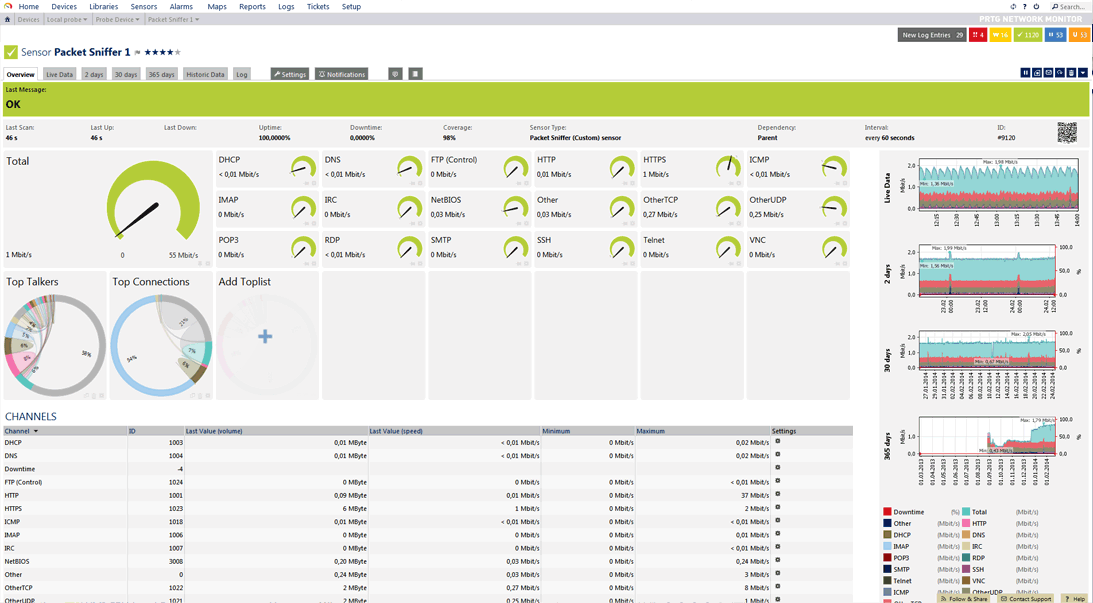
Paessler PRTG is a network management tool that uses SNMP to scan your network from top to bottom for vulnerabilities. PRTG has a more complex user interface than most other network monitoring products. Every dashboard, graph, pie chart, or display is sprawling with information. In a live monitoring environment this can be both a help and a hinderance.
That being said, the PRTG setup process is very convenient because the user doesn’t need to run through any configurations. The auto-discovery feature will scan through the network and recognise devices automatically. Auto-discovery allows you to avoid the unpleasant experience of trying to catalogue your entire network inventory. However, you will still have to put in your log information and SNMP settings.
Notifications are another area that PRTG Network Monitor does exceedingly well. Notifications are customizable and can be configured to react to various thresholds and events. For example, you could set a trigger for a device to something like “When Free Bytes channel is below 20 for at least 60 seconds perform Ticket Notification”. Once an event happens these notifications are sent to you by email or SMS.
Even though the user interface can be intimidating, PRTG Network Monitor remains one of the top network management tools available. Given the hefty price of this product, we recommend that this tool be used by larger organizations. The XL5 package is available for $1,400 (£1,042) and allows you to monitor up to 100 monitors. If you need more than the XL1 package PRTG offers unlimited sensors for $13,436 (£10,101). PRTG also has a free trial that can downloaded from this link here.
3. ManageEngine OpManager
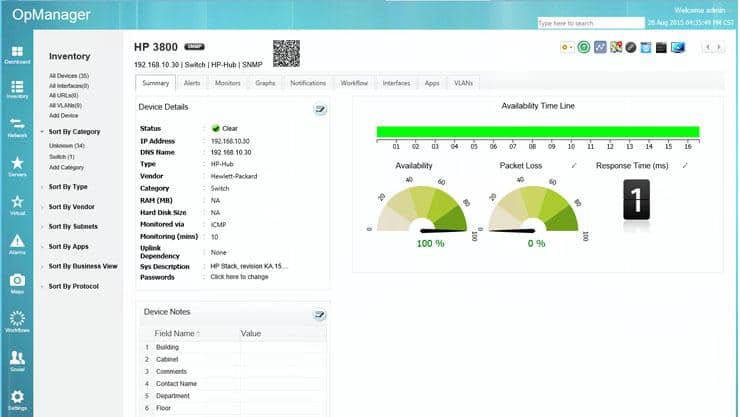
ManageEngine OpManager is one of the main network management software products used at the moment. The reason is that OpManager is adept at targeting poor performance within large network environments. OpManager’s dashboard displays your infrastructure availability, status, and utilization on one screen. All of this information is updated in real-time so that you can keep up-to-date with new issues.
Of all the products on this list, ManageEngine OpManager has one of the most satisfying user experiences. The clarity of the charts, dials, and graphs against the white background help you to accurately read the state of your network when working in a live network environment.
One of the standout features of OpManager is its use of add-ons and plugins. There are a variety of additional tools you can use with OpManager to customize your overall monitoring environment. Add-ons like Network Traffic Analysis, Network Configuration Management and VoIP Monitor can be incredibly useful.
The only issue with ManageEngine OpManager is that it doesn’t cover web-based network infrastructure. This makes it unsuitable for network environments that rely on web-based applications. While other products in the ManageEngine suite do cover web-based infrastructure, this remains a missed opportunity for OpManager itself.
Organizations that require a robust and convenient network management tool couldn’t go wrong with Manage OpManager. OpManager is available from $595 (£447) dollars upwards. This fee covers 25 devices and there are a number of other price points until you reach the maximum of $16,495 (£12,414) for 500 devices. There is also a free version that can downloaded from this link here.
4. Zabbix

Zabbix is an open source network management solution that uses SNMP and IMPI to scour a network for poor performance and vulnerabilities. It allows you to monitor your device utilization, network bandwidth, and overall network health. This is supported by the design which has to be one of the cleanest open source experiences ever created. Zabbix can monitor everything from computers to MySQL, Oracle and Microsoft SQL Server databases.
With a rate of 3 million checks per minute, Zabbix has more than enough power to keep up with the needs of even the most demanding networks. In addition, its miniscule CPU usage means it can be run without adversely affecting your system’s performance. Zabbix is thus an ideal choice for deployment in large organizations.
Like other more expensive platforms on this list, Zabbix has a range of visualization options in the form of graphs and charts. You can create customized graphs from scratch to compare particular aspects of your network infrastructure. Customizing what you see in this way allows you to troubleshoot for certain issues and performance concerns.
All-in-all Zabbix is a very competent network management tool. Mid-to-large organizations would do well to adopt this platform on account of its leanness and scalability. Undoubtedly the best part about Zabbix is that it is completely free and available via a web interface. There are also downloads available for Centos, Ubuntu, Debian, Red Hat Enterprise Linux and Oracle Linux. Zabbix can be downloaded from this link here.
5. Nagios XI
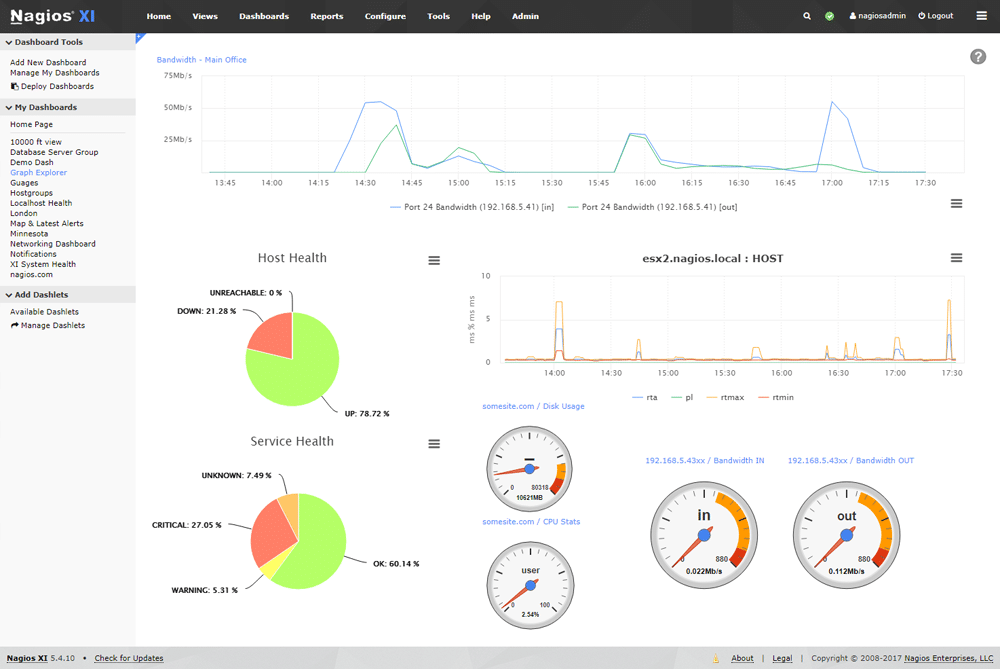
Few software providers deliver a network monitoring experience as compelling as Nagios XI. Nagios XI is a network management tool that operates through a web-based user interface and provides users with a diverse range of network monitoring features. The core dashboard design is a little more basic than other tools on this list, but what it lacks in extravagance it makes up for in readability.
The dashboard is broken down into a variety of views from service and host summaries to your network’s top alert producers over the past 24 hours. This product comes packed with a range of visual displays including pie charts and graphs detailing your network performance.
Nagios XI is incredibly user friendly. The platform has dozens of configuration wizards to help you set up various parts of your network monitoring environment. These include wizards for Auto-Discovery, DHCP, DNS Queries, Domain Expiration, FTP Server and Mail Server. The Nagios wizards really help you become acclimatized to the various features that Nagios has to offer.
The only drawback with Nagios XI is that it is limited to CentOS and Redhat Enterprise Linux. However, if you’re running those operating systems then this is one of the most accessible network monitoring products you’ll find. The Standard edition can be purchased for $1,995 (£1,497) and the Enterprise edition for $3,495 (£2,632). You can also download a free version from this link here.
6. Icinga
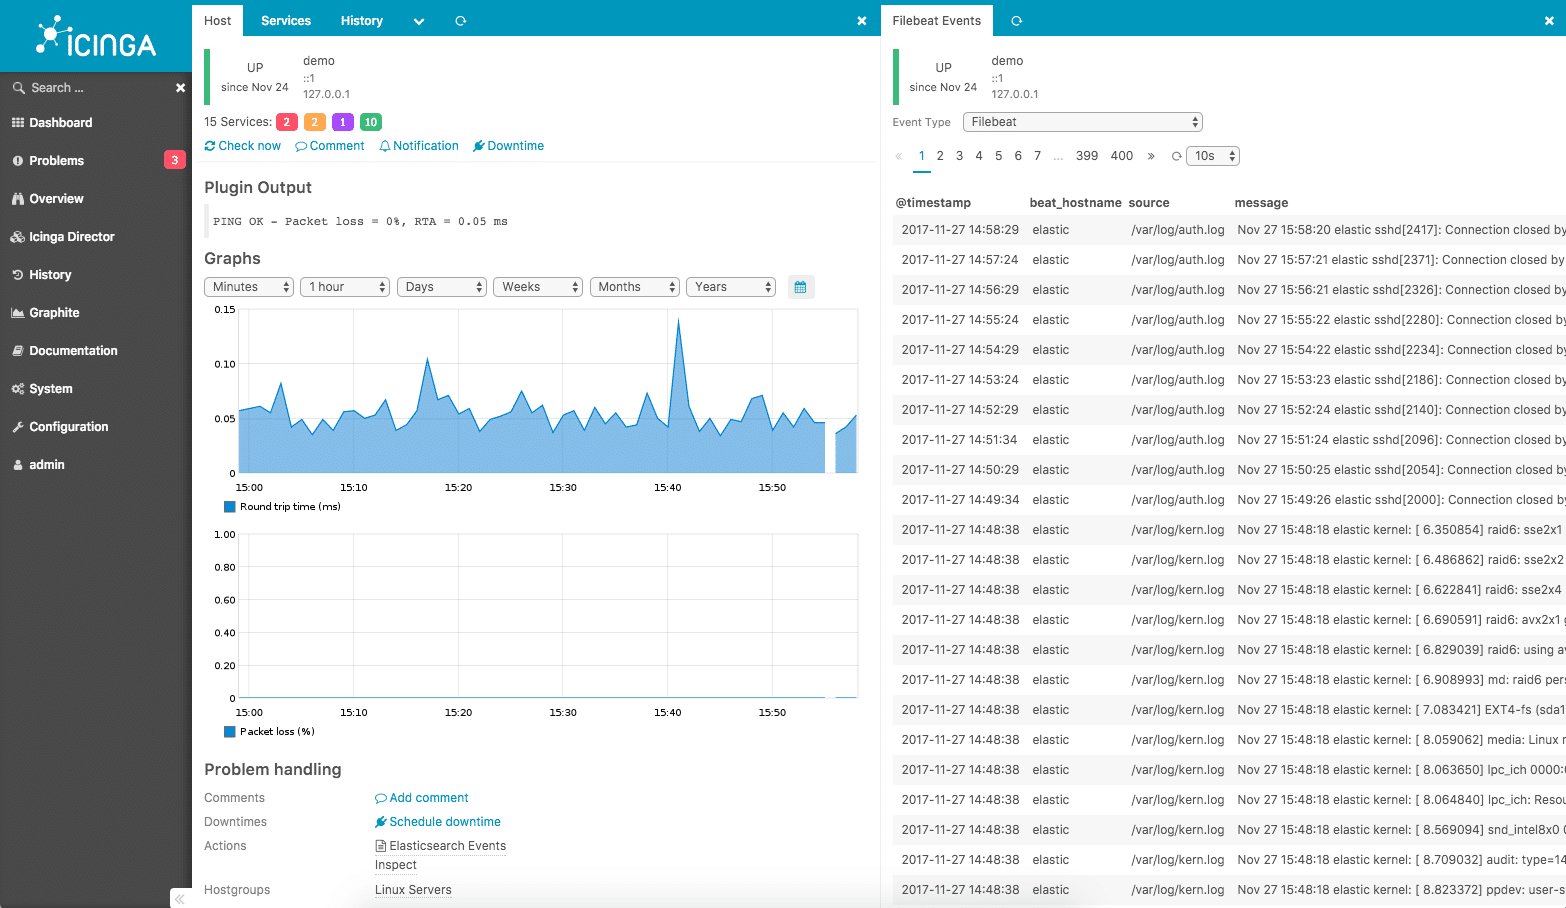
Icinga 2 is a network management tool that uses SNMP to scan for network performance issues. Icinga 2 is used by many network administrators on account of its versatility. It supports an open source range of management tools, and configuration management tools like Puppet and Chef. All of this is underpinned and secured through the use of SSL.
Compared to Zabbix, the Icinga user interface is clean but not as straightforward. While there are visualization features like graphs and charts these are often obscured by clunkier displays. This isn’t to say that Icinga offers a bad user interface, just that it is not on the same level as Zabbix or SolarWinds in this respect (especially if you aren’t a fan of the RESTful API).
What is impressive is Icinga’s compatibility with external plugins. There are over 500 plugins that can be used with this software. It is interesting to note that these include products from other providers such as Nagios, Zabbix, and OpenNMS. These can be viewed on the Icinga Exchange website. Currently, over 8,000 people have downloaded the NagVis – Map Visualization Add-on.
Icinga 2 is a tool that is ideal for users looking for a versatile network monitoring solution. The ability to incorporate third-party plugins and work through the RESTful API does open some extra doors to you, even if the user experience isn’t the best. Icinga 2 is available for free and can be downloaded from this link here.
7. Spiceworks Network Monitor
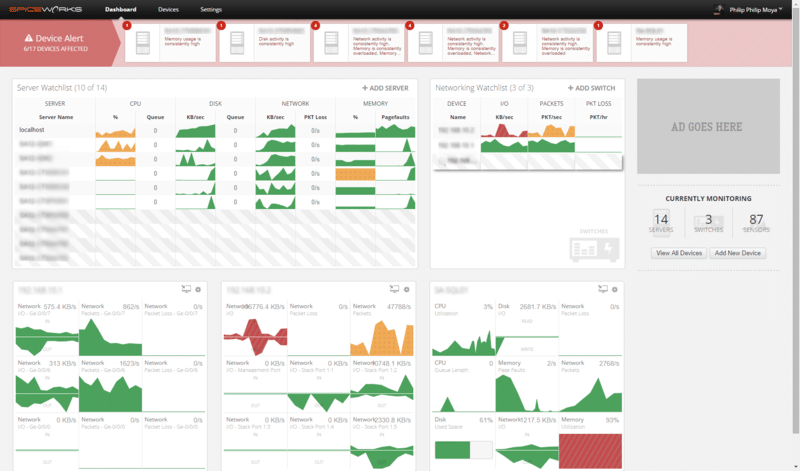
Spiceworks Network Monitor is one of the most popular network monitoring tools on this list. With a large and active user support community, Spiceworks is a program that has become a core tool for many network administrators. This platform uses SNMP to conduct real-time monitoring to oversee your network elements. On the dashboard you can add servers and network elements to a “Watch List” to make sure you only see those crucial services when you launch the program. Once placed on a Watch List you’ll be able to see graphs detailing each device within this section.
The quality of this products visualization features is on par with the highest performers on this list. Whereas PRTG feels cluttered when monitoring lots of systems, Spiceworks Network Monitor doesn’t because of how the dashboard is broken down into smaller tiles. While third-party advertising can be an inconvenience it doesn’t intrude on the user experience too much.
User alerts are a feature that Spiceworks delivers very well too. You can define alert parameters based on metrics such as CPU utilization, disk utilization, or packet loss. Alerts make sure that you don’t miss anything important. Once your trigger conditions are met you will be notified by email or SMS depending on your choice.
Spiceworks Network Monitor’s superb network perspective and ease of use have made it one of the strongest products on our list. Whether you’re working with an SME or larger organization, SpiceWorks has the bandwidth to support the scale of your IT infrastructure. Price-wise you don’t have to worry about expensive deployment because Spiceworks Network Monitor is completely free and can be downloaded from this link here.
8. GFI LanGuard

Finally, we have GFI LanGuard. GFI LanGuard is a mid-level market tool available for Windows, Mac OS, and Linux users. With this program you can also drill right down to the applications that your hardware is running, and is designed to monitor security elements like antivirus software and firewalls.
GFI LanGuard is well-known because of its patch management feature. Generally, when security breaches happen on a network it is because of a lack of up-to-date network patches. GFI LanGuard’s solution is to scan your network devices and identify those devices that are vulnerable to external threats. The GFI website notes that GFI LanGuard has patches for more than 60 applications and operates across Windows, Mac OS, and Linux.
Although GFI LanGuard’s user interface isn’t as clean as some of the higher-end products on this list, it is simple enough to help you get the job done. You have the option to display your network usage in everything from pie charts, to dials, to graphs. Sections like Most Vulnerable Computers show you those problem devices that need to be addressed ASAP.
GFI LanGuard’s payment structure is also very scalable. Smaller organizations with 25-49 nodes can use GFI LanGuard for a price of $22 (£17) per year per node. Organizations with more demanding requirements can purchase nodes 50-249 at $12 (£9.33) per node. Large organizations can monitor modes 250-2999 for $8 (£6.67) per year, per node. A free trial of GFI LanGuard can be downloaded from this link here.
9. WhatsUp Gold
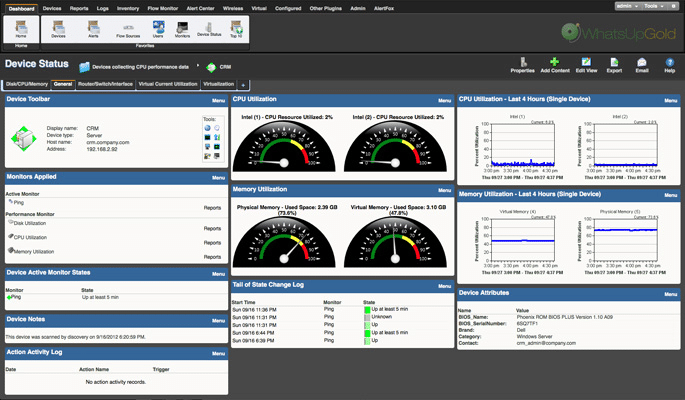
Our next network management tool on this list is called WhatsUp Gold. WhatsUp Gold is a network monitoring tool designed by a company called Ipswitch. This platform has developed a name for itself because of its minimalist design. Like Network Performance Monitor, the majority of your monitoring is conducted through a dashboard. The main dashboard numbers all of your devices that are up or down. You can also view key information like ping availability and interface utilization.
On the dashboard there are multiple different views you can toggle between: Top 10, Actions and Alerts, Wireless, Cloud, Storage, Core Network and Wireless Network. These tabs help to breakdown your network so that you don’t have to waste time looking for what you want. For example, if you wanted to ensure that your cloud services were up and running you could click through the Cloud view and verify this in seconds.
One of the most useful features that WhatsUp Gold has is its alerts system. Alerts are configurable so that can you choose to be notified about network events via SMS or email. WhatsUp Gold executes this very well, particularly when you can view relevant alerts immediately through the Actions and Alerts page.
WhatsUp Gold is an excellent product because it has been designed to make the monitoring process as straightforward as possible. When you’re dealing with a large network you need to be able to tell from a glance whether your infrastructure is performing to an acceptable standard. This is something that WhatsUp Gold gets perfect.
We recommend that larger organizations look into deploying WhatsUp Gold on account of its fast design and clear monitoring. There are a number of pricing options available for WhatsUp Gold on the Ipswitch website. Subscription plans range from $990 (£743) a year for 50 devices to $2990 (£2,246) for 100 devices. You need to contact them directly if you want to find out the price of perpetual licenses. You can download WhatsUp Gold from this link here.
SolarWinds Network Performance Monitor: Editors Choice Network Management Tool
It is indisputable that network management tools have become a prerequisite for keeping companies online. Ensuring that a large network stays operational over a long period of time requires constant maintenance. You can’t anticipate when a key service is going to fail or when devices are slowing to a crawl; you need hard evidence and oversight.
Network management software products like SolarWinds Network Performance Monitor help you to keep a watchful eye over your network. In network maintenance, prevention is better than a cure. That why tracking your real-time network usage will allow you to detect when small problems are emerging before they become a problem. ‘Nipping these issues in the bud’ stops them from contributing to downtime later on.
We have picked Network Performance Monitor as it works well within organizations of all sizes and remains easy to use from start to finish. Whereas other platforms take on a fancier approach, network monitoring is an area where less is more. The dashboard gives you everything you need. After all, as long as you can tell exactly what is happening on your network, what more can you ask for?


