If you were to ask network administrators about the most famous network analyzer in the world, you’d be hard pressed to find a professional who wouldn’t say Wireshark. Wireshark has developed a reputation as a trusty packet analysis tool that is lightweight and easy to use. Network administrators in SMEs and large organizations have been using WireShark to troubleshoot network faults and access for unauthorized programs. In this article we’re going to look at how you can use WireShark to monitor network traffic.
What is Wireshark?
Before we break down how to monitor network traffic we’re going to look at what Wireshark is. Wireshark is first and foremost a network analyzer that is used to conduct deep packet analysis. Wireshark takes data from packet transfers across your network and displays it in a format that you can read. This data allows the user to generate insights into what processes are happening within packets in real-time or historically.
Once this packet information has been pulled from the network it can be used to create graphs and charts to develop a clear perspective of activity across the network. While all of this sounds quite complicated it is actually quite simple in practice. With Wireshark you use display filters to choose which packets you monitor from your network and use them to help your troubleshooting process.
Downloading and Installing Wireshark
The first thing you need to do is to download and install it. The good thing about Wireshark is that it is a free tool that can be downloaded directly from the company website. We recommend that you download the latest version available on your device to make sure that you get the smoothest operating experience. You can find this information by going to the “stable release” section.
Windows
Once you’ve downloaded Wireshark from the product website you can start the installation process. During installation you will be prompted to install WinPcap. Make sure you do this because without it you won’t be able to capture live network traffic and will be restricted to open saved capture files. You can install WinPcap by checking the Install WinPcap box.
Mac
Installing Wireshark on the Mac is a little more complex. To start the installation you need to download an installer. There are many different third-party installers you can choose but we recommend xquartz based on its simplicity. Once this is done, open up the terminal and enter the following command:
<% /Applications/Wireshark.app/Contents/Mac0S/Wireshark>
Now wait for Wireshark to start.
Capturing Data Packets with Wireshark
Capturing data packets is the heart and soul of Wireshark. Your network analysis starts and ends with the settings you use to capture packets. Initially, you’ll want to learn how to capture packets in general but as you become more experienced you’ll start to apply display filters to determine the type of packets you raise. However before you try to capture packets, there are three things you need to do:
- Ensure that you have the administrative privileges to start a live capture on your device.
- Choose which network interface you want to capture packet data from.
- Choose the correct location to capture packets from.
Once you’ve done these three things you’re ready to start the capture process. When you launch Wireshark the following screen displays:
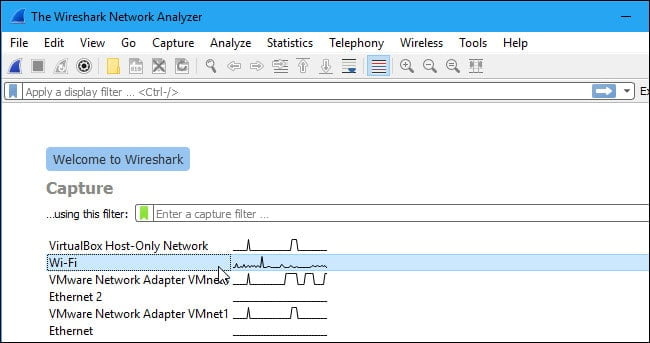
The first thing you need to do is look at the interfaces that are available for capture. You can do this by selecting Capture > Options. This will display the Capture Interfaces dialog box shown below:

To select the interface you want to monitor, select its checkbox. Once the interface is checked press the Start button to begin. You can select multiple interfaces if you want to capture data from multiple sources at once.
There are a couple of other methods you can use to run a capture as well. You can press the Shark Fin button on the toolbar to start the capture process. If you’d rather work through the command line you can enter the following command to launch a capture:
$ wireshark -i eth0 -k
Once you’re ready to stop a capture you can press the red Stop button (located next to the Shark Fin.)
How to Inspect Captured Packets
Capturing packets with Wireshark is just the beginning. Once you’ve captured packets you need to start analyzing them. Analyzing packets in Wireshark is all conducted through three panes: the Packet List pane, Packet Bytes pane and the Packet Details pane.
Packet List
The Packet List pane shows all captured packets and divides them up into information detailing their Number, Time, Source Destination, Protocol, and Info. The time shown on the screen is the number of seconds from creation, the destination is the end location they were being sent to, and the protocol is the type of protocol that was being used in the transfer. The info section is used to provide additional information that can add context to the packet transfer.
Packet Details
The Packet Details pane is found underneath the packet list pane and shows the protocols of the chosen packet. Clicking on the arrow next to each segment of packet information will provide you with additional information. If you right-click on a row you can also apply additional filters if you desire.
Packet Bytes
At the bottom of the screen you can see the Packet Bytes pane. This is where the internal data of a packet is shown. Highlighting a packet’s information in this section will flag the corresponding data in the Packet Details pane. All data is show in hexadecimal format with 16 hexadecimal bytes and ASCII bytes. You can change this by right-clicking and choosing an alternative format.
Analyzing your Network Performance with WireShark
Once you’re ready to start analyzing your network performance then you should close down all active applications on your network. This is useful because it reduces traffic to a state where you can monitor network activity more clearly. It may surprise you to know that even if you turn off all your applications you will still have a substantial volume of packets being sent and received.
It is at this point that you’re ready to apply capture and display filters. These are the two types of filters that can be used on Wireshark. Capture filters are used to filter information that will be collected from a live capture before it is captured. Once you start capturing packets you cannot adjust the capture filter. In contrast, display filters are used to filter out data that has already been recorded. Display filters determine what you see when you’re looking through packets that have already been captured.
The simplest way to filter your packets is to use the Filter box located below the toolbar. If you type TCP into the Filter box, then you will be provided with all the packets that included the TCP protocol within their content. There is an extensive list of filters that can be applied to analyze packets. The list is too long to go into detail here, but there is a list of all filters available on the Wireshark website here.
You can also select a filter by clicking on the Bookmark icon on the left hand side of the entry field. This will show you a menu of popular filters. Likewise you can also activate a display filter by clicking on the arrow to the right hand side of the entry field (You can also click Analyze > Display Filters to choose from a list of default filters). Once you’ve chosen a filter right-clicking on a packet and clicking Follow > TCP stream will provide you with its TCP conversation between the client and server.
Color Coding
One of the most important aspects of conducting network analysis through WireShark is understanding color coding. Each packet is color-coded so that you can tell what types of packets have been captured at a glance. For example, light purple indicates that TCP traffic has been captured and UDP traffic can be identified by light blue. Black is used to flag packets that have some kind of error.
Wireshark comes with a default configuration of colors but you can configure your own settings as well. There are around 20 colors that you can choose from which can be edited or disabled. To turn colorization on or off, click on the View menu and click Colorize Packet List and select your desired option. A full list of coloring rules can be accessed by clicking View > Coloring Rules.