In today’s world, productivity is based in large part on network speed and connectivity. Network bottlenecks can slow down progress or even bring business to a halt. Bandwidth monitoring can help you identify bottlenecks so you can investigate the underlying issue and establish baselines so you know how your network is performing today.
In this article, we’ll review some of the basics of bandwidth and bandwidth monitoring then we’ll dive into some popular bandwidth monitoring tools available today for Windows, Linux, and more. If you’re already comfortable with the topic of bandwidth monitoring, feel free to
>>>Jump to the list of bandwidth monitoring tools below<<<
What is bandwidth?
In a nutshell, network bandwidth is a measurement of how much data per second a given connection can support. Common measures of bandwidth are Mbps (megabits per second) and Gbps (gigabits per second).
A common way to conceptualize this is to imagine network data traveling over a highway. The more lanes the highway has, the more data can move. Bandwidth is the number of lanes on that highway. As the lanes become more and more congested, traffic slows down. These “traffic jams” are often referred to as “bottlenecks”.
Why should you monitor bandwidth?
Monitoring bandwidth enables you to understand the general bandwidth consumption on your network and identify potential bottlenecks. Understanding your network’s baseline for bandwidth helps you better plan future projects and catching bottlenecks early can prevent them from becoming a major issue. It can also help you make sure your service providers are living up to their SLAs (Service Level Agreements).
On the flip side of that coin, if you are a business that provides internet service or otherwise charges for bandwidth consumption, monitoring bandwidth enables accurate billing and helps you ensure you are meeting or exceeding your SLA agreements with customers.
Alternatively, if you’re a home user you may be interested in better understanding how you are using your bandwidth or getting an estimate of how long downloading a file of a given size might take (see #4 on our list if this is you).
Common causes of bottlenecks
There are a number of reasons you may experience network bottlenecks. Some of the reasons for bottlenecks are:
- Bandwidth hungry devices – Certain applications or nodes may use a disproportionate amount of bandwidth on your network and create bottlenecks. Examples include an application downloading multiple large files or streaming HD video.
- Spikes in network traffic – Events that drive more people to a website or server can create bottlenecks. Think tax services in April or a big sale on an ecommerce site.
- Network hubs – Network hubs do not break up collision domains on a per-port basis. If there are still network hubs on your network, consider replacing them with switches.
- Misconfigurations– An improperly-configured switch, server, or script could lead to congestion on your network.
- Broadcast storms – Broadcasts are messages sent to an entire network segment, which means they generate significantly more traffic than a similar message sent to a single host. A broadcast storm occurs when a network is bogged down by broadcast (or multicast) messages. The aforementioned points about network hubs and misconfigurations are two possible sources of broadcast storms.
- Malicious programs – If a node on the network is compromised, you may see a significant spike in traffic (e.g. if the node is used as part of a botnet).
- Under provisioned bandwidth – In some cases, you may just need more bandwidth than you currently have and purchasing more capacity from your ISP (Internet Service Provider) may be the right way to go.
- An issue with your ISP – Sometimes bandwidth issues may have a root cause outside of your network. If you know your bandwidth is not under-provisioned and within your network it is fine, bandwidth issues with Internet-facing traffic may suggest you need to investigate the problem with your ISP.
Protocols used to monitor bandwidth
There are a number of methods and protocols used for bandwidth monitoring. Understanding the differences can help understand the pros and cons of the different methods used by the various tools available. Some of the common protocols used to monitor bandwidth include:
- SNMP – Simple Network Management Protocol (SNMP) is used by a number of tools to capture bandwidth data by polling an SNMP-capable device over a network. Many of the values polled via SNMP for bandwidth monitoring are defined in RFC1213.
- WMI – Windows Management Instrumentation (WMI) can be used to poll Windows hosts locally or over the network for a variety of information including bandwidth statistics.
- Flow protocols – There are a variety of flow protocols that can be used to capture network traffic data from routers. Cisco’s NetFlow is one of the most popular protocols, but there are a number of others like sFlow, Jflow, NetStream, and Rflow.
Given the above, SNMP may make sense if you would like to query a number of hosts running different operating systems from a central location and aggregate the data. In a strictly Windows environment, WMI may be all you need. Alternatively, a flow protocol may be better suited for aggregating data from routers spread throughout a network.
Now that we’ve reviewed the basics of bandwidth monitoring, here is our list of the best bandwidth monitoring software:
- SolarWinds NetFlow Traffic Analyzer (FREE TRIAL)
- Paessler PRTG (FREE TRIAL)
- SolarWinds Real-Time Bandwidth Monitor
- Manage Engine NetFlow Analyzer
- BitMeter OS
1. SolarWinds NetFlow Traffic Analyzer (FREE TRIAL)
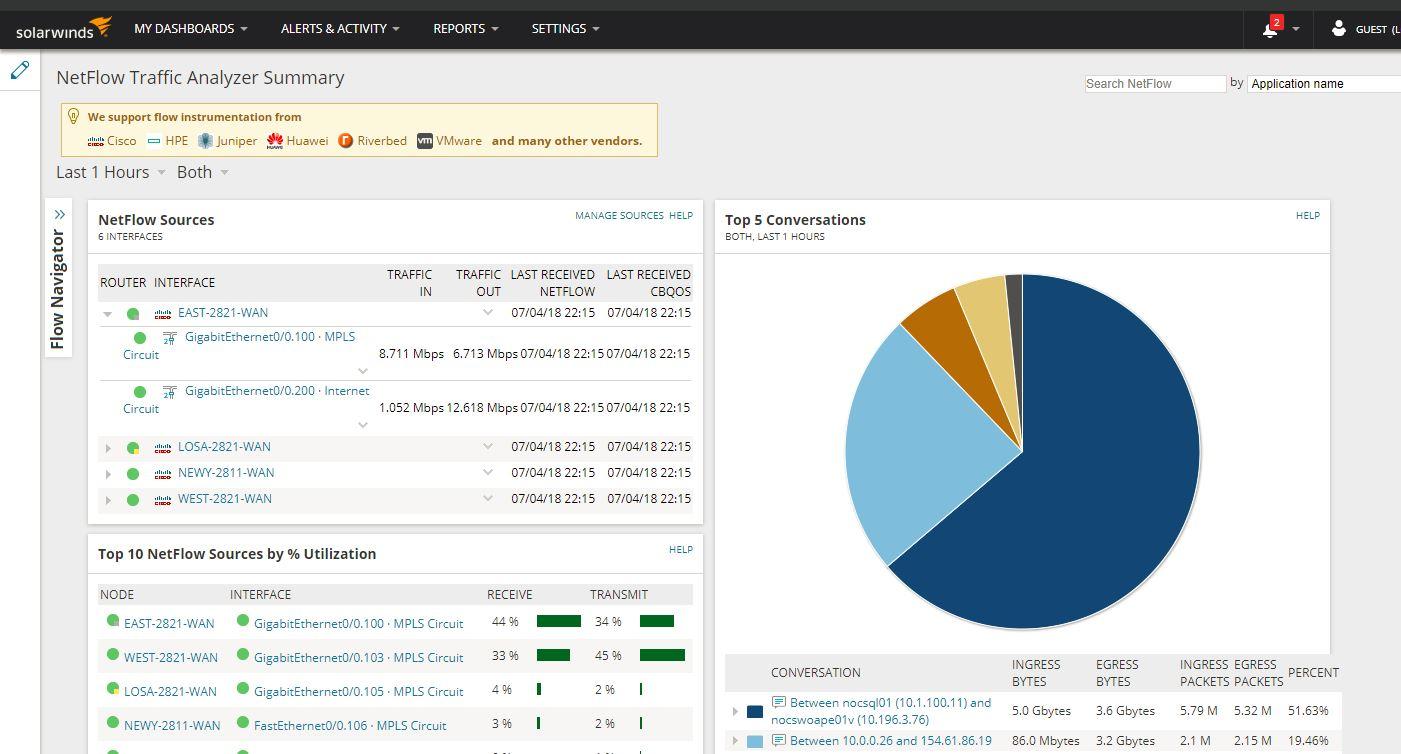
SolarWinds NetFlow Traffic Analyzer includes a variety of features to create a robust traffic analysis and bandwidth monitoring solution. The NetFlow Traffic Analyzer supports NetFlow, IPFIX, sFlow, and a number of other flow protocols. Additionally, it has built-in support for NBAR2 and Wireless LAN Controller (WLC) traffic.
Advanced features of the Netflow Traffic Analyzer include: customizable reports, a customizable dashboard network traffic analysis and cross-stack network data correlation, Quality of Service (QoS) monitoring and policy optimization, monitoring of TCP/UDP port 0*, and integration with SolarWinds User Device Tracker (UDT) to help you identify users that are hogging bandwidth.
*Pro-tip: if you see traffic on port 0, it is almost always a problem.
You can download a fully-functional 30-day trial here or click here to take the NetFlow Traffic Analyzer for a test drive directly from your browser.
If you’re looking to add features like intelligent alerts, network insight, wireless monitoring, and management, and network performance baselines to your bandwidth monitoring solution, consider using SolarWinds Network Bandwidth Analyzer Pack. The Bandwidth Analyzer Pack bundles the Netflow Traffic Analyzer with the Network Performance Monitor (NPM) to provide an even more robust solution. You can get your free trial of the Network Bandwidth Analyzer pack here.
2. Paessler PRTG (FREE TRIAL)
Paessler PRTG is a popular network monitoring and management solution from Paessler. One of the many features included in PRTG is bandwidth monitoring. To enable bandwidth monitoring, PRTG supports a variety of sensors that use protocols like SNMP, WMI, IPFIX, and various flow protocols. These sensors can be monitored directly using the various graphs and charts within PRTG or used to create reports that you can then export.
It is important to note that PRTG licenses are based on “sensors”. The freeware version of PRTG supports up to 100 sensors, but that does not necessarily equate to 100 discrete network devices. Sensors are monitoring elements (e.g. a given data point, like a ping response from a given interface on a server) not a node (e.g. the entire server).
You can download the freeware version of PRTG or a free trial of the full version here.
3. SolarWinds Real-Time Bandwidth Monitor
SolarWinds Real-Time Bandwidth Monitor is a free Windows tool that uses SNMP (Simple Network Management Protocol) to poll bandwidth statistics from target devices. This tool supports SNMP v1, v2c, and v3.

You can poll multiple interfaces on a device at the same time and the tool graphs the data for easy visualization of the statistics. You can adjust polling time to increase the granularity of reporting and the monitor will continue to run in the system tray after you minimize the graphical user interface (GUI).
4. Manage Engine NetFlow Analyzer

Manage Engine offers a NetFlow Analyzer product that enables bandwidth monitoring, traffic analysis, and customizable reports. This tool offers granularity down to the minute in reports, detection of context-sensitive network anomalies (helpful for zero-day attacks), traffic shaping via access control lists, NBAR support, and an SLA monitor.
In addition to supporting flow protocols, Manage Engine’s NetFlow Analyzer supports SNMP v1/v2c/v3, WMI, Telnet, SSH and more.
You can download a free 30-day trial for Windows or Linux here.
5. BitMeter OS

BitMeter OS is a little different than the other options on our list in that it simply monitors the bandwidth of the computer it is installed on. This limits the tool’s functionality at scale, but it can serve as a helpful tool for those of you looking to learn more about how your PC is consuming bandwidth and calculate download speeds.
You can try a demo of BitMeter OS directly from your browser here. You can download BitMeter OS, which is an open source tool, for Windows, Linux, or Mac OS X for free here.
Summary
That was our list of top bandwidth monitoring tools. One of these tools may be just what you need for your next bandwidth monitoring project. Do you have experience with any of the tools mentioned here? Are there any tools we missed? Let us know in the comment section below.


