VMware is one of the leading hypervisor providers, creating “virtual machine” (VM) environments. If you have VMware virtualizations operating at your business, you are probably using EXSi, which is the company’s core host system.
The creation of a VM system is complicated because it connects hosts to guests over a network by the use of software. So, if you are running this system in your business, you need to keep track of server, application, and network health in order to avert system failure. If you operate several ESXi hosts and manage them through vCenter Server, monitoring gets even more complicated; implement that over a WAN or shift to VMware’s Cloud solutions and you’ve got internet performance to consider as well.
You specifically need integrated infrastructure monitoring tools in order to keep on top of all potential problems with the complex VM configuration. You need a view of the full stack in order to manage VMware environments and you can’t waste time exporting data from one monitoring tool into another, or trying to consolidate monitoring data in a central customized utility.
VMware monitoring tools
The requirement for full stack monitoring capabilities actually does you a favor when you are investigating infrastructure management software. Although the specific requirements of VM cuts out a lot of the smaller tools providers in the market, the upside of these reduced options is that you save a lot of time when researching candidate systems. In this guide, we are going to cut down your research effort even further, by recommending the top ten VMware monitoring systems.
Even within the specialized field of all-in-one monitoring tools, you still have plenty of options and many of them are very good.
Here is our list of the best VMware monitoring tools:
- SolarWinds Virtualization Manager (FREE TRIAL)
- Paessler PRTG Network Monitor (FREE TRIAL)
- SolarWinds VM Monitor (FREE TOOL)
- Manage Engine Applications Manager
- Veeam One
- LogicMonitor
- eG Enterprise
- Turbonomic
- Quest Foglight
- WhatsUp Gold with Virtualization Monitoring Add-on
You can read more about each of these recommendations in the following sections.
1. SolarWinds Virtualization Manager (FREE TRIAL)
SolarWinds Virtualization Manager is probably the best VMware monitoring package available on the market at the moment. SolarWinds has a reputation for excellence and its unified platform for all of its infrastructure management tools makes it the perfect choice for the cross-modular requirements of VM monitoring. That platform is called Orion and it means that you can integrate other SolarWinds products with your Virtualization Manager to get a single interface for all of your system administration tasks. This monitoring system is designed to cater to the complexities of multi-server, WAN, Cloud, and hybrid topologies.
The SolarWinds Virtualization Manager is particularly strong at managing VMware and Hyper-V hypervisors. So, if you have a mix of these two systems on your network, you can centralize the management of your total VM environment through this SolarWinds tool.
The tool’s first task on installation is to discover your VM environment. You don’t need to spend time setting the system up because the Virtualization Manager does all of that work for you automatically. This is a great time saver and it also removes the risk of human error.
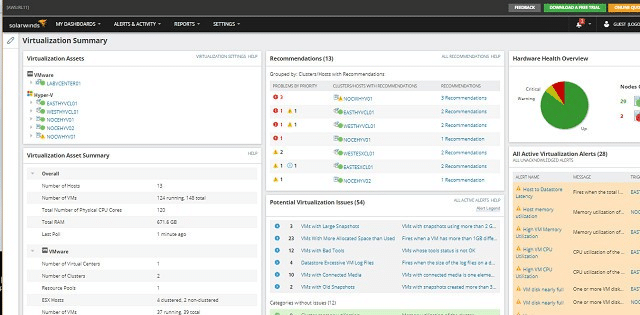
The Virtualization Manager’s dashboard includes some great visual elements, such as dials and graphs. If you run Hyper-V as well as ESXi, the dashboard will show all of your servers for each in two separate lists, but in the same screen. This enables you to check on all of your VM environment at a glance, while still being able to tell which server runs which system.
A panel in the main screen shows alert conditions with warnings colored yellow and critical conditions colored red. Another panel shows potential sources of problems in a watch list of elements that are approaching their capacity warning level. This watch list is a great feature because it gives you time to plan a mitigation strategy, so if the threshold get hit, you will be ready to act.
Two nice features of this tool are its Application Stack and Perf Stack. The Application Stack page organizes status statements by the stack level of the service that it relates to, so you see running end-user software at the top of the screen, the applications that support the software lower down, the services that support those services beneath them, and so on. The statuses are represented as color-coded symbols that depict user groups, applications, transactions, databases, servers, and hosts. Again, yellow represents a warning and red shows critical conditions.
Perf Stack enables you to assemble your own view of the application stack in graphical form. Each monitor is represented as a line graph of live data over time. You nominate which elements should appear in this view and that gives you a simultaneous view of all events of the VM system in a series of graphs that line up one above the other. You will be able to see demand surges ripple through the stack as higher demand from user applications causes greater utilization of supporting resources.
The Perf Stack feature is a cross-modular feature of the SolarWinds common application platform. This unifying environment means that different modules will integrate together seamlessly and particularly contribute to inter-module features, such as Perf Stack. Some other SolarWinds applications that complement the Virtualization Manager well are the Storage Resource Monitor, the Network Performance Monitor and the NetFlow Traffic Analyzer. These will give you greater insights into the operations of your network devices and the data throughput passing through the entire network.
The main dashboard screen shows live data, but it is possible to store data for analysis. Two great analysis features of the Virtualization Manager are its capacity planning assistant and the “sprawl manager.” These enable you to project traffic growth and identify specific areas of the VM environment that could soon become permanently under strain. At the same time, you will be able to see areas that are over-provisioned, supporting a strategy to reallocate resources to head off bottlenecks and utilize idle resources.
A simulation feature enables you to run case scenarios on the present infrastructure’s capabilities to examine the effects of adding on more users or more applications. Factors that the simulator models include CPU utilization, memory capacity, storage space, and network bandwidth.
The Virtualization Manager package includes a reporting tool, which comes with pre-written report formats. You can also create your own customized reports. Those reports can be launched on demand or scheduled to run periodically.
You can test the SolarWinds Virtualization Monitor on a 30-day free trial.
2. Paessler PRTG Network Monitor (FREE TRIAL)
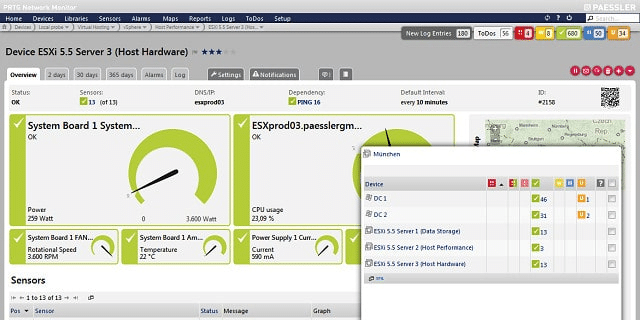
Paessler PRTG Network Monitor has a unique architecture among infrastructure monitoring packages that makes it ideal for managing virtualizations. It is a three-in-one monitor and combines network, server, and application monitoring in one package. The services covered by PRTG are split out into separate modules by the other major players in the infrastructure monitoring market.
Paessler is aware of this advantage and has integrated VM monitoring into its standard package. It is an official VMware Technology Partner. The PRTG system is comprised of a series of sensors. You tailor your implementation yourself by deciding which sensors to turn on. The price structure for PRTG is based on ranges of sensors, so the more sensors you turn on, the more you pay. A sensor is an individual monitor or utility. For example, there is a Ping sensor, and there is a switch port monitoring sensor, with one instance monitoring one port.
PRTG can monitor VMware virtualization. However, if you have a multi-vendor environment, don’t pass this monitoring tool by because it is also able to monitor Citrix Xen, Microsoft Hyper-V, Amazon EC2, and Parallels Virtuozzo Containers.
Your PRTG deployment can be limited to just your VM environment, or you can use it to monitor your entire network, servers, and applications. The network monitoring elements of the package cover network device health and traffic analysis. The extent of your usage of PRTG depends entirely on how many of the sensors you activate. Essentially, you get the whole package delivered to you, whether you turn all of it on or not.
The on-site software of PRTG runs on Windows Server. There is also a cloud-based Software-as-a-Service version (SaaS). However, this requires collectors to be installed on your system and they will only run on Windows Server, so if you have a Linux environment and no Windows servers, this package is not for you.
The monitoring reach of PRTG is not limited to one site, so it will cover an entire WAN and also include cloud-based resources. It is also able to fully monitor hybrid environments.
Network monitors employ the industry-standard SNMP procedures to collect status information from network devices. The package includes sensors for traffic data collection following the NetFlow, IPFIX, J-Flow, and sFlow standards and there is also a packet sniffer sensor available.
The server statuses monitored by PRTG include CPU load, disk usage, and network interface speeds. There are also sensors available to watch the power consumption, battery voltage, fan speed, and temperature of the server and its rack.
Both network and server statuses trigger alerts of threshold levels are breached. Alerts are shown in the main screen of the dashboard and can also be sent out as notifications by email and SMS. You can customize the dashboard to create limited views for different user accounts, which makes task delegation safer. You can also customize alert conditions and the recipient of alert notification can also be tailored according to alert source and severity. The dashboard includes graphics, such as dials, line graphs, and pie charts that make statuses instantly comprehensible.
Color-coded statuses are also shown on the network maps that are automatically generated by PRTG. These maps are updated constantly through SNMP queries and reflect any hardware changes. The map layouts available in the interface include an innovative “sunburst” view, which displays all of the applications running on the system with the application stack serving each radiating out from a central disc. The color-coded statuses of each layer and the irregular depth of each line gives the map the appearance of a flaring sun.
The reporting tool of the system ships with pre-written report formats and you can also create your own. Reports can be scheduled to run or issued on demand.
A combination of status graphics, traffic analysis, and alerts will help you identify where services are overstretched and where resources are underutilized, enabling you to reallocate resources to where they are needed the most.
Paessler offers a 30-day free trial of PRTG with unlimited sensors for 30 days. You can use PRTG free forever if you only activate up to 100 sensors.
3. SolarWinds VM Monitor (FREE TOOL)
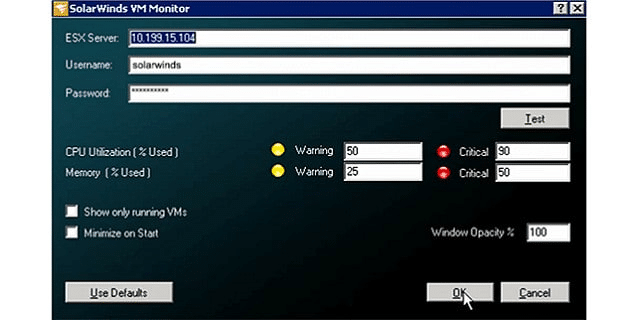
SolarWinds offers a virtualization monitor that is permanently free of charge. This is the SolarWinds VM Monitor.
Although this is often billed as a “cut-down version of the Virtualization Manager,” it is actually a separate product written from scratch. It is a standalone utility and doesn’t integrate into the Orion platform, so you can’t blend it into the Network Performance Monitor or the Server and Application Monitor.
Despite that caveat, this is still a great tool for small enterprises running a VMware virtualization. The monitor is only able to track one host and it focuses on the memory and CPU performance of the server.
Once installed, the monitor runs continuously. However, status checks do not happen every second, so you can initiate a data update on demand. The tool also shows metrics for network usage, the number of VMs configured on the host and the number of VMs that are live. You can reduce the display of statuses to filter out the VMs that are not running, to reduce the number of records in the screen. Statuses are color-coded with yellow signifying a warning and red representing a critical condition. You can fine-tune the performance thresholds that form the rule base of the monitor. These settings trip warnings and alerts when they are breached.
If you have more than one server, you can still use the monitor, allocating a different instance to each server. However, this means that you will end up having to switch between windows to keep track of all of your VMs, so if you have three or more servers, that strategy won’t be very satisfactory. The SolarWinds VM Monitor runs on Windows Server and it is capable of monitoring VMware and Hyper-V virtualizations. SolarWinds offer the VM Monitor as a free tool on their website.
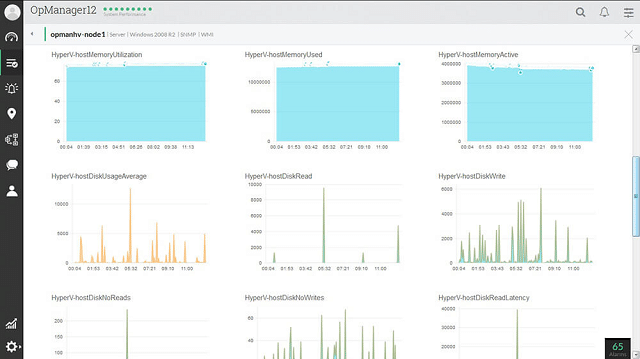
4. ManageEngine OpManager
The management of virtualizations is difficult to define in terms of the division of labor traditionally imposed by software providers when they create VM monitoring tools. Is it application monitoring, server monitoring, or network monitoring? ManageEngine has struggled with this issue over the past few years. In truth, you need both OpManager and the Applications Manager produced by ManageEngine in order to get the full VM capabilities of the provider. If you can only afford one of these modules, go for OpManager because this is the tool that ManageEngine currently signals as its VMware monitoring center.
You may have heard of the free ManageEngine VM Manager Plus and want to learn more about that. However, stop searching because it doesn’t exist anymore. ManageEngine has integrated that tool into OpManager, which isn’t free. The company does still have one VM-related free tool that you could use for VMware monitoring. This is the VM Health Monitor. However, for a full VM monitor, you should check out OpManager, which covers both network and server monitoring.
Despite the company’s struggle to properly define virtualization in its family of products, the current status of the VMware monitoring capabilities bundled into OpManager is exceptional. This shows that even when the ManageEngine marketing department has a crisis of faith, its technicians still keep up their world-beating standards. ManageEngine tools are top of the class and really would be the best in the world if the company’s management could stop tinkering with the boundaries of its products.
As well as being a general network and server monitor, OpManager has screens that specifically relate to virtualization. The package performs resource discovery on installation. This will also spot and map your VMware implementations. OpManager is capable of monitoring ESX/ESXi, Horizon View, and vCenter. If you operate a multi-vendor site or even a hybrid network with both onsite and cloud-based elements, you can still use OpManager. Like VMware, the tool can monitor Citrix XenServer and XenApp, Docker, Microsoft Hyper-V and Azure, Amazon EC2 and RDS, and also cloud implementations of OpenStack.
The map formats of OpManager include a straightforward topology diagram showing network devices and the links between them. This can be filtered to show just switches or just routers and you can also get it to feature the networks elements engaged in VM delivery. Device labels can be the hostname, MAC address, or network IP address, according to your preference. If you have a WAN or a hybrid implementation, you can see it overlaid on a zoomable world map. The mapper can also show the layout of your server room and the racks in each of your server cabinets.
Server monitoring covers:
- CPU capacity and utilization
- Disk volumes and usage
- Server interface activity and network load on the server
- Memory usage
- Rack support services
- Power source performance
- Fan activity
- Temperature
OpManager ships with thirty status tests that are applied continually to the VMware environment. These conditions include performance thresholds and hardware statuses. Error and status problems identified with these checks get reported on the system dashboard as alerts. Those alerts can be forwarded to team members by email, SMS, web alarms, RSS feed, and Twitter DMs. It is also possible to link scripts of actions to perform on the raising of a specific alert, so remediation can be managed automatically by OpManager.
Status data can be stored and this provides the source material for the OpManager capacity planning module. The analytical engine plots trend and variance maps from historical data, extrapolating projections of future resource requirements. This enables you to spot specific applications and VMs that are using up resources. The planning tool is able to create a model from existing data that enables you to test the consequences of new demand.
OpManager and Applications Manager integrate seamlessly and both run on Windows Server and Linux. ManageEngine offers this tool on a 30-day free trial. You can use OpManager for free to monitor up to 10 devices.
5. Veeam One
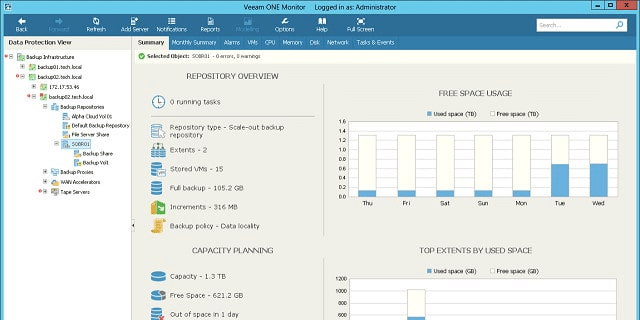
Veeam Software produces a range of tools to enhance the performance of virtualizations. This is called the Veeam Availability Suite and it includes support for VMware vSphere and Microsoft Hyper-V. The purpose of these tools is to keep the VMs available around the clock and the system monitoring tool in the suite is called Veeam One.
A major focus of the Availability Suite is the management of data and configuration of VM activities. This is performed by the Backup and Replication Manager. As this is a key feature of Veeam’s activities, monitoring the backup process also forms a central responsibility of Veeam One.
The Veeam One architecture relies on “sensors.” These are the data collection components of the tool and there are 200 of them in the software bundle. These sensors focus on hardware statuses and also process flow speeds. Each sensor has integrated alarms that will notify you of warning conditions and critical statuses. These alarms are set in a rule base that specify a performance level that will trigger the notification. You can also set up your own rules to generate customized alerts.
Alerts are posted to the dashboard, but you can also have them sent as email notifications. Both the dashboard and alerts are customizable, so you can create limited views for junior staff and get alert emails diverted to different team members according to a set of rules. The dashboard is organized with tabbed screens that help you switch to separate categories of data. The layout is uncluttered which makes each view easy to scan, but it also means that some crucial data is always going to be out of sight. Once you get familiar with the operation of Veeam One, you can crowd all of your essential data panels onto one page.
The reporting module of the monitor also provides performance insights. These reports can be customized if you find that the information you need to see on one page is actually spread across several existing reports. All of the data points that make up the lists and graphs in the screen can be accessed as raw data and also stored, which makes them available for analytical reports.
The monitoring tool includes tenant tracking and billing features, which make this ideal for MSP environments or corporate IT departments that act as cost centers. The main aim of the entire Availability Suite package is to avert disaster and support clients around the clock without having to keep every desk in the organization manned at every moment. However, global MSPs will find that the rotation of the earth means that it is always office hours somewhere in the world and so the benefit of slow hours never arises.
There is a free version of Veeam One, but that doesn’t include the customer identification and billing modules. It is unusual that there is no data throughput limit or sensor cap in the free version. However, the free Veeam One doesn’t allow you to set up customized alerts.
Another limitation of the Veeam One Free is that it doesn’t include the analysis and planning features that are part of the paid version. Those planning features interpret historical data to derive capacity trend analysis and predict future demand. They also highlight system capacity issues with the current infrastructure layout to help you allocate resources more efficiently. You can get a 30-day free trial of the full paid Veeam One system.
6. LogicMonitor
LogicMonitor is an infrastructure monitoring tool that has special modules dedicated to virtualizations. The tool has built-in capabilities that are able to interact with VMware vCenter and VMware ESX/ESXi host and guest configurations. If you operate a multi-vendor environment, you should still consider LogicMonitor because it is also compatible with Microsoft Hyper-V and Citrix XenServer systems.
The LogicMonitor system is delivered on the Software-as-a-Service model from the Cloud. It is platform-neutral, so you don’t have to worry whether it is suitable for monitoring with the operating systems on your site because it covers them all.
Being based elsewhere, the service can also track cloud resources and remote sites just as easily as it can track your on-premises resources. Access to the dashboard is through a browser, so your monitoring team can get equal access wherever they are in the world. This makes a globally-distributed administration team possible and it also means that you can include telecommuters and remote specialists in your support team. This is a great service for companies that operate a virtual office.
Despite being managed remotely, the LogicMonitor solution does require some onsite software installation. In the case of cloud-based resources, those collector programs need to be installed on those remote servers. You may be concerned that this data transfer exposes your business to snoopers and hackers. However, all communication between data collectors and the central LogicMonitor data manager servers is encrypted. Similarly, access to the dashboard through a browser is protected by user authentication and transmission encryption. Data storage on the LogicMonitor server is also encrypted, so even the service provider’s technical staff can’t get access to your data.
The installation process of the collectors is managed with installer wizards to make the task as automated as possible. Once the collectors are in place and you have your user account set up on the LogicMonitor server, the system will begin its service life with a system scan, logging all of your network devices, server types, applications, and software. This stage spots your VMware virtualizations and logs and maps their elements. The system discovery process is very comprehensive; it will also spot virtual switches, backup, and storage paths.
With VMware, the load on hosts and the performance of the servers that support them are particularly critical. The LogicMonitor controllers keep track of the CPU load, memory usage, disk functions, disk data rates, disk IO/s, and VMkernel swap rates.
Data throughput speeds between the network devices on your network and the health of each network switch and router are also closely monitored. The LogicMonitor focus is not just that the virtualization is working, but that it is fully-optimized and delivering service to users at acceptable speeds.
Performance thresholds trip alerts when they are breached. These alerts appear in the dashboard and they can also be sent out to team members as email, SMS, or Slack notifications. You can customize alerts and also create rules that route alerts to different destinations according to source and severity. This is a useful tool for businesses that outsource infrastructure provision and have service contracts because you can get the alerts sent out automatically to those providers, eliminating the need for an in-house team member to put through a call.
The customizable dashboard is also very useful for allowing limited access to service providers and junior team members. Data-only views or report tool access can be granted to non-technical managers.
LogicMonitor is charged by subscription. The company produces three service levels. However, there isn’t a free version. The three levels are Starter, Pro, and Enterprise and it is easy to upgrade if your business grows mid-plan. You can get a 14-day trial of LogicMonitor to test it for yourself.
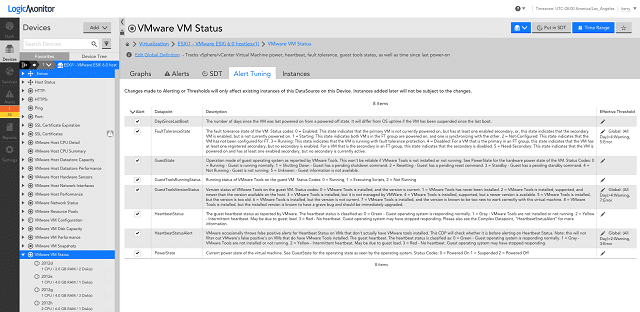
7. eG Enterprise
The eG Enterprise solution focuses on applications monitoring and it has specialized modules that cover virtualizations. You can monitor your VMware vSphere with this tool and it is also compatible with Microsoft Hyper-V, Citrix XenServer, Oracle VM Server, Red Hat Enterprise Virtualization, AIX LPARs, and Solaris Container virtualizations. Although eG Enterprise is geared toward applications, it will also monitor the hardware and services that support your VM environment.
The dashboard for the service is browser-based. The data collectors on your network activate as soon as you install the software. These sweep your infrastructure periodically to gather statuses. The initial pass around the network generates a system inventory, covering all of your hardware, including servers, and network devices. The discovery phase also notes your applications and software, recording the elements that create your virtualizations and mapping them. The autodiscovery phase also creates a general network map.
The system inventory gives eG Enterprise a data baseline. Polling for status updates also spots changes to infrastructure and the addition or removal of applications. The traffic that serves your virtualizations is also logged for its throughput rates and speed of delivery. The monitor includes a rule base, which defines normal service behavior. If one of the conditions tracked by these performance parameters goes out of bounds, eG Enterprise will generate an alert in the dashboard.
Errors, failures, and delays in the delivery of services to the VM may be caused by any underlying piece of hardware or software. The application stack mapping of eG Enterprise enables the monitor to identify exactly which element of your VM system is causing problems. That means you don’t have to waste time drilling down from the user software delivery metrics to identify the root cause of performance issues.
Multi-vendor sites and hybrid site/cloud configurations can create difficulties for monitoring software. However, these architectures don’t present problems for eG Enterprise. The tool unifies data from disparate sources to give you a full system overview and can identify the source of performance issues across site boundaries and vendor device groups. The dashboard will also present segmented reports on the performance of elements by type, vendor, location, or protocol, enabling you to compare and assess different providers for future acquisitions.
So you can see both unified and segmented data through the dashboard. This multi-level view lets you get a summary and then element-specific performance data. This is useful for spotting overloaded resources and underutilized services. Stack views with color-coded statuses help you decide where resources need to be added or relocated.
The eG data view perspective is called “in-n-out monitoring.” The summary view is termed “outside.” It depicts each VM as a band. The size of the band expands and contracts in line with that VM’s activity. The drill-down VM performance detail view is the “inside.” In this, you see a visual representation of the stack layers supporting that VM, each element is colored according to status and sized in line with its utilization.
The dashboard also has a critical path view of each VM, showing the services that chain together to provide it. Again, each element in the line is color-coded for status. This is another investigative shortcut that helps you get straight to the cause of any performance issues.
There isn’t a free version of eG Enterprise, but you can get a free trial and there is also a demo facility on the service’s website.
8. Turbonomic

Turbonomic is marketed as a monitor for cloud-based resources and that includes virtualizations. The system is also capable of tracking the performance of onsite infrastructure and can cover multi-site WANs, distributed teams, and hybrid architectures. Turbonomic is itself is delivered as cloud-based Software-as-a-Service. The monitor is compatible with VMware and also Hyper-V and XenServer.
The sensors in the Turbonomic system are called “workloads.” The monitor searches through your network on installation and compiles a list of infrastructure, services, and software. Each element that contributes to the provision of a VM are traced and put into a workflow. The workloads engaged in that delivery are shown on a diagram with their interdependencies. The status of each element is shown in color. The monitor will continually update these statuses and each check will also notice configuration alterations and adjust the inventory and workflows automatically.
The initial sweep of the system is billed as a health check. After all of your VM environment has been mapped, Turbonomic will produce a list of recommendations on how to improve the configuration of your infrastructure. Data collection uploads are protected by encryption as is the data at rest on the Turbonomic server.
Ongoing monitoring raises alerts when performance issues occur and you can set up actions to be performed automatically to remedy problems. You can choose whether those actions should kick in automatically, whether the system should ask you first before implementing the action, or you can just turn off the automatic remediation feature and implement all solutions manually. The higher service plans of Turbonomic include more analytical features in identifying suitable actions to take. Many of the more complicated solutions are derived through the use of AI.
Although you get better action decision with higher plans, all Turbonomic service plans include capacity planning features. Regular status scanning highlights traffic patterns, identifying over-burdened resources and underutilized infrastructure. The capacity planning feature operates on stored data. It includes a test case utility that will run new service scenarios through a model created from existing traffic patterns and infrastructure capacity. This can help you plan service expansion and identify new infrastructure requirements.
The highest plan of Turbonomic includes features that are specifically aimed at service providers. The dashboard includes a policy database that implements service level agreements and converts them into threshold monitors, which themselves will trigger alerts. Logging those boundary performances also enables MSPs to demonstrate compliance and data access audit trails help with both billing and security compliance. The policy section of the dashboard also translates contract conditions; therefore, it will automatically produce service metrics such as data throughput, user access periods, and response times for metered charging.
As the service is located in the Cloud, the dashboard can be accessed from anywhere. This is great for organizations that want to enable telecommuting, or who have agents out in the field or spread across the globe. The dashboard access is controlled by user authentication and none of the plans impose a limit on the number of user accounts that you can set up. Each account can be allocated a differently customized dashboard. This enables you to delegate access to junior members and give limited views to non-technical managers. The two higher service plans of Turbonomic includes self-service screen templates, which would be particularly useful for MSPs.
The charging structure for Turbonomic is subscription-based with three service levels: Essential, Advanced, and Premier. The system is organized as a service, called “workloads.” The main difference between the three plans is the number of workloads that the user can engage. The Essentials plan includes up to 500 workloads. The two higher plans have no limit on the workloads that can be used. The higher plans progressively include more features such as tenant tracking and AI rulebases.
The Turbonomic architecture is innovative, flexible, and scalable. The ability to access the service from anywhere is a boon to the active entrepreneur and major corporations alike. The service can cater to any size of enterprise. You can get a 30-day free trial of the Premier package.
9. Quest Foglight
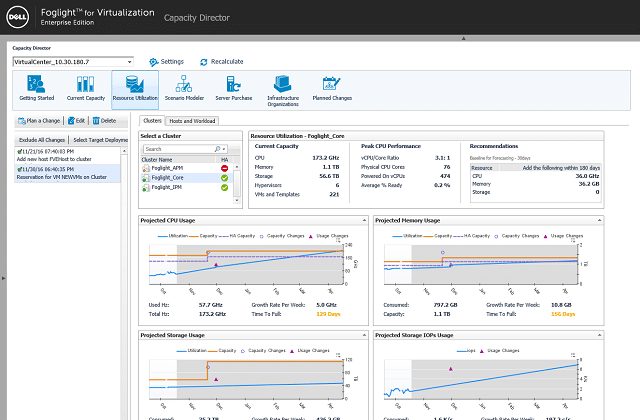
Foglight is a full virtualization infrastructure management system. It doesn’t just monitor VM provision, it optimizes it. The service includes special competence in speeding up disc access for faster backup and recovery. User response time improvement is another special feature of Foglight.
This service will monitor on-premises, cloud-based, and hybrid architectures. The software installs on Windows, Linux, and Solaris. The software is compatible with VMware and it can also monitor Hyper-V and Citrix Xen systems. If you employ both VM systems, Quest Foglight will provide you with unified monitoring. The main data source for this monitor is at the vSwitch. However, it will also monitor hardware performance and connection metrics.
All of the data needed to get the monitor operating is gathered automatically by the tool on installation. This discovery process will map all of the resources that contribute to the delivery of each VM on your network. Once ongoing monitoring starts, Quest Foglight will look out for error conditions and also identify traffic and resource utilization per VM and per service, logging which areas of the network are under strain, and highlighting underused resources. The monitor spots inactive VMs and kills hanging abandoned processes to free up resources and optimize network and server utilization.
Foglight is particularly effective at managing resource allocation. This is a much bigger feature than its performance alerts because the monitor can actually head off status impairment by dynamically remapping your hypervisor hosts and guests. The effect is that, when properly tuned, the Foglight methodology will eradicate almost any potential performance failure and so you won’t receive any alerts.
Problems that can’t be solved by resource adjustments get shown in the dashboard as alerts. Foglight doesn’t just display alerts, but also adds on suggestions of actions to take to solve the problem.
A very nice visualization feature in the dashboard is the network map which shows the physical location of all of the resources that contribute to your virtualizations. This feature extends to a zoomable real world map, which is great for systems that are provided by a WAN or include cloud-based services. Traffic flows across each network segment are shown live on the map and you also get capacity and response time feedback.
Traffic monitoring is performed through deep packet inspection. Foglight tracks NetScaler performance and network latency. The load on physical devices and virtual switches are other performance factors that are closely monitored. These insights help to prevent bottlenecks from forming at switches and keep data flowing around the network. Maintaining the health of network devices also heads off the dangers of dropped packets, which can really slaughter the response times of VMs.
As well as displaying process data live, Foglight stores it for later analysis. This contributes to the creation of a test environment that gives you the ability to run case scenarios. With this, you can model new service projects and plan new resources to fulfill expanded capacity requirements. Ongoing capacity planning also benefits from the analytical engine’s ability to derive trend growth from historical traffic patterns and plan for future organic growth. Analysis assistance also helps highlight peak and low load times, and traffic variance, or “sprawl” around the network.
Quest Foglight is a very intelligent system support service for virtualizations and that quality doesn’t come free. Fortunately, Quest offers a free trial, so you can get to know Foglight’s benefits before you commit money.
10. WhatsUp Gold with Virtualization Monitoring Add-on

WhatsUp Gold is an infrastructure monitoring system that focuses on the health of network devices. The monitor can be extended through add-ons. Ipswitch, the producers of WhatsUp Gold has produced a Virtualization Monitoring add-on, so if you opt for WhatsUp Gold you will need to make sure to buy in that add-on as well as the base package. It isn’t possible to run the Virtualization Monitor without already having the base system installed.
WhatsUp Gold uses SNMP procedures that enable the monitor to search the network and log all infrastructure upon installation. The Virtualization Monitor extends this action to trace and record all of the elements that contribute to the creation and management of each VM on your system. The Monitor is able to detect VMware and Hyper-V implementations. The discovery phase maps the relationships between the components of your VM structure. A feature of this discovery process is the creation of a network map that shows the links between your VM resources. This map can get pretty complicated even on small networks. Fortunately, it is possible to filter the view and also customize the map.
Once the inventory, the VM plan, and the network map have been generated, WhatsUp Gold will send out periodic status requests to update the inventory and the map automatically. This polling process enables the processor to spot changes in infrastructure. The polling is frequently set to one minute by default, but you can alter that through the dashboard.
SNMP device agents monitor each device and send out trap messages if they encounter warning or critical conditions. These traps get interpreted into status alerts that are displayed in the dashboard. The data processor also updates the network map, which shows a color-coded status for each device. The decision on what condition constitutes a warning or a critical status is laid down in a rule base. You can add your own rules to create your own custom alerts, which can even be made up of composite triggers.
Both the inventory list and the map provide access to device and application detail pages. This page will show you the capacity and the utilization of that resource among other metrics. Server statuses that are displayed in the detail page include CPU, memory, disk, and interface utilization. The remapping of guests to host gets shown live in the dashboard.
The dashboard is completely customizable. There are a number of visualization widgets that you can place on pages and you can crowd in features on the Homepage to remove the necessity of switching to different pages in order to get all of the information you need. You can also create a range of dashboard layouts and allocate one to each team member, enabling more effective and safer task delegation. The WhatsUp Gold package ships with a set of standard report formats, but you can also create your own.
Ipswitch offers a number of bundles that include the Virtualization Monitor together with the base WhatsUp Gold system. All WhatsUp Gold modules install on Windows Server. If you opt for the Systems Admin’s Bundle you also get the Application Performance Monitor along with the base application and Virtualization Monitoring. Ipswitch offers a 30-day free trial for all of its software.
Monitoring VMware
All of the packages on our list of recommendations offer free trials, so you can assess each of them risk-free. This guide features all of the major players in the infrastructure monitoring market and also includes some very interesting contender packages that include innovative developments, such as AI decision making and automatic guest allocation adjustments.
The underlying technologies that support virtualizations are so varied that it isn’t sufficient to just rely on the monitoring services that VMware ships with its products. You need to take into account that your entire network extends beyond the functions of your VMware software and that adjustments or expansions within your virtualizations can very quickly impair the other systems and services that you have running on your network. So, monitoring all of your infrastructure and not just the elements of your virtualizations is essential.
Do you already use one of the VM monitoring tools on our list? Have you found a different tool that you think is better than the ones that we have listed? What do you prioritize as the key service that a virtualization monitor should provide? Leave a message in the Comments section below and share your experiences and opinions with the community.