In an enterprise network there are few components as important as servers. These crucial tools have the responsibility of sending information to other computers through a LAN or WAN. Managing servers is one of the arts that an administrator must know inside and out. Servers are some of the most demanding types of infrastructure you’ll ever encounter in terms of monitoring.
Manually monitoring servers is a nightmare because you need to constantly monitor the utilization, performance and maintenance of server tools. As a result it is important to have a server management tool that makes this process easier so that you don’t need to keep monitoring your server endlessly. In this article we look at the top server management tools available on the market.
What to Look for in a Server Monitoring Tool
Not all server monitoring tools are made the same and when you’re looking for a server monitoring platform we advise you to opt for one that has a high quality dashboard. A good dashboard will provide you with a centralized location where you can monitor your server (or your entire network as well). Ideally you want to have real-time data on CPU, memory utilization, and disk space to monitor effectively. These metrics will provide you with the foundations to identify how well your device is performing.
One feature that will make your monitoring efforts much easier is that of alerts. Alerts keep you update when your server metrics cross a problematic threshold. This means that you can take a step back from the monitoring process. It also means that you don’t need to look out for every little trend manually as the system will automatically bring this to your attention when it is time to take action.
Here is our list of the best server management and monitoring tools:
- SolarWinds Server and Application Monitor (FREE TRIAL)
- Paessler PRTG (FREE TRIAL)
- Icinga 2
- Zabbix
- ManageEngine Applications Manager
- Nagios XI
- Ipswitch WhatsUp Gold
- Monitis
1. SolarWinds Server and Application Monitor (FREE TRIAL)
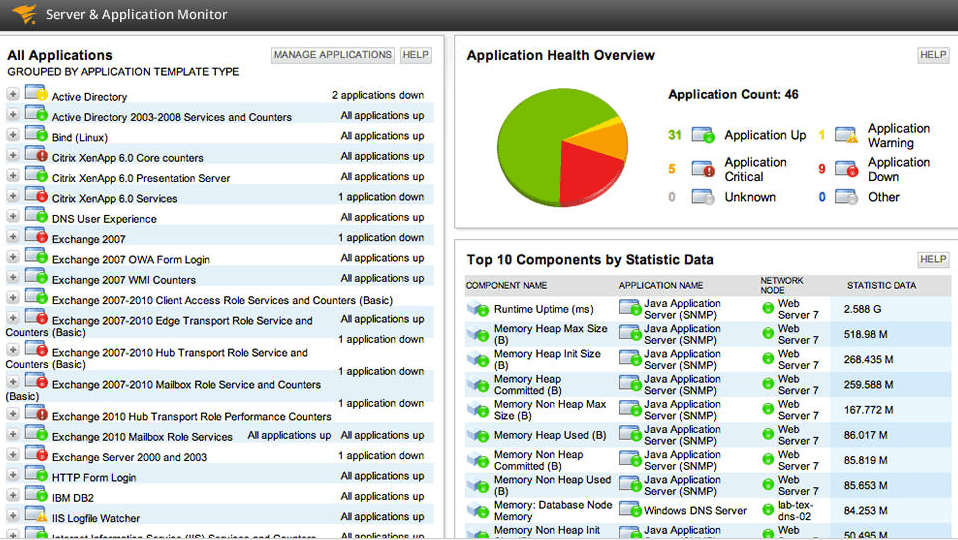
SolarWinds Server and Application Monitor is one of the apex level infrastructure monitoring products available right now. This platform offers infrastructure monitoring for Azure and AWS with over 1200 performance monitoring templates. These templates come preconfigured out of the box to support systems such as Active Directory and IBM WebSphere. The main advantage is that you don’t have to create your own configurations from scratch (unless you choose to).
In terms of centralized perspectives SolarWinds Server and Application Monitor offers you the excellent AppStack dashboard. Through the AppStack dashboard you can view a break down of all your available system resources. This includes a pie chart showing your total objects next to a section that denotes those with issues. On the left hand side of the page there is a status navigation tree which allows you to view the status of all objects in your network. Objects are categorized as Down, Critical, Warning, Unknown, Unreachable, Up and External.
This creates a user experience that is very easy to navigate in a live environment. You don’t need to remember anything or search through lots of complex windows because everything is in front of you. If an object is experiencing difficulties then you can click on it and you will be provided with a list of issues that were flagged under the Components with Problems section. This allows you to respond appropriately and immediately.
There are many different pricing options for SolarWinds Server and Application Monitor starting from $2,995 (£2,290). There are pricing options for 150, 300, 700, 1100, 1500 and unlimited monitors. However you’ll need to contact the sales team in order to receive an exact quote. There is also a 30-day free trial which you can download from this link here.
2. Paessler PRTG (FREE TRIAL)
Paessler’s PRTG is a product that gets a lot of attention as a freeware infrastructure monitoring product. It offers a complete monitoring experience from network monitoring to server monitoring for mail, web, database, and virtual servers. What makes this platform great for server monitoring is its scalability. All licenses can be upgraded when you take on board new infrastructure.
In providing a true monitoring experience few features are as important as an alerts system. PRTG has a well-designed alert system that notifies you via email or SMS if a device is experiencing difficulties. The alerts system is also customizable allowing you to dictate the alert thresholds you’re using. The advantage of this is that you can dictate which events the system is monitoring so that you don’t have to manually monitor them yourself.
Any administrator deploying a server monitoring solution is likely to be in need of capacity planning as well. PRTG helps you to recognise when your infrastructure needs to be upgraded in the future. This ensures that you stay operational all year, even during periods of fast growth.
PRTG is free to use for up to 100 sensors. If you need any more sensors then you’re going to need to pay extra. The first paid product can be purchased for $1600 (£1,223) for 500 sensors. The next solution on the price scale is 1000 sensors for $2850 (£2,180). If you need a lot more then you can purchase 5000 sensors for $10500 (£8,032). Very large enterprises can make use of the XL1 package which offers an unlimited amount of sensors for $14500 (£11,091). You can also download a 30-day free trial from this link here.
3. Icinga 2

Icinga 2 is an open source server monitoring tool that was inspired by Nagios Core. This inspiration resulted in one of the best free server monitoring experiences available on the market. With Icinga 2 you can monitor devices throughout your network and run monitoring with the help of the RESTful API. The RESTful API allows you to change your configurations through a Command Line Interface (CLI). This provides you with complete control of the program.
This program uses a customizable dashboard which allows you to add additional plugins from the Icinga community. You can also segment dashboard views by user. In other words you can restrict what each user sees. The Icinga community has a plethora of plugins available so we recommend searching around to see what you can get your hands on.
One area where configurations come through particularly well is that of the alerts system. You can configure users and groups to receive email and SMS notifications. You can even create rules to determine an escalation chain. An escalation chain will determine what happens if the first point of contact doesn’t respond promptly. This is excellent for providing an organized response once an issue has been found.
Icinga 2 offers a solid monitoring experience. However, if you’re not familiar with coding then you’re unlikely to get the best out of the RESTful API. As a result we only recommend this product if you have a strong knowledge of coding. Icinga 2 can be downloaded for free from this link here here.
4. Zabbix
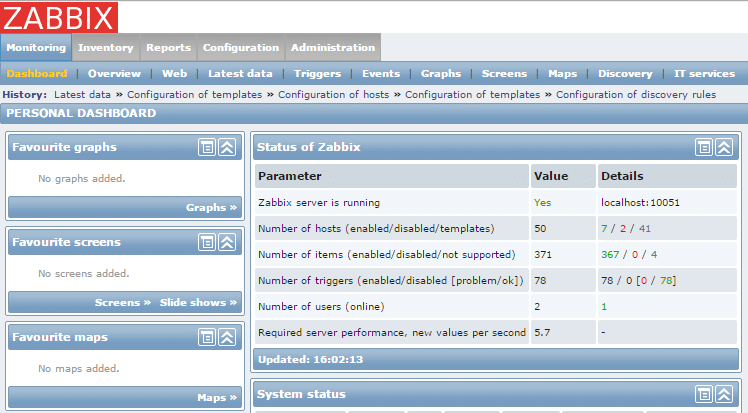
Zabbix is another open source network monitor that stands in with robust server monitoring capabilities. Zabbix has the ability to monitor Linux, IBM, Dell, Solaris and Lenovo systems for key metrics like CPU usage, memory utilization, disk space and temperature. Similarly, Zabbix also offers default templates for all of the services above to help new users hit the ground running. If this isn’t enough there are a range of additional templates on the Zabbix website and the Zabbix community website.
The autodiscovery feature on Zabbix not only detects new topology changes but it can also detect configuration changes. For example, if you add a new network module to a device then the system will recognize it. This is a relief because it means that Zabbix can automatically keep up with your configuration updates (even if the firmware is updated).
You can create custom alerts through Zabbix to be sent through email, SMS, or Messenger. You can not only customize your messages with additional details but customize based on recipient as well. The idea behind this is to segment the responsibilities of responding to problems so that recipients are only given the information relevant to their role in resolving the problem.
Overall Zabbix is a robust infrastructure monitoring tool. Its network monitoring potential is excellent for a free tool, so we recommend this if you’re looking for server monitoring as well as being able to monitor other elements like network bandwidth usage. As it is an open source tool Zabbix is available for free. You can download Zabbix from this link here.
5. ManageEngine Applications Manager

ManageEngine Applications Manager is an infrastructure monitoring tool that is adept at conducting server monitoring. ManageEngine Applications Manager has its own Server Performance Monitor which can monitor CPU usage. With this utility you can easily see any devices that are consuming too many server resources. You can also use ManageEngine Applications Manager to view the CPU utilization, storage and heat of your server as well.
The program has the ability to work with Windows, Linux, Solaris, IBM AS400, AIX and HP-Unix/Tru64 Unix servers. However ManageEngine Applications Manager isn’t limited to traditional physical servers. It can also work alongside virtualized systems like Microsoft Hyper-V, VMware ESX/ESXi, Citrix XenServer and Docker. The sheer versatility of ManageEngine Applications Manager is enough to keep up with most administrator’s needs.
However what really makes ManageEngine Applications Manager a standout product is its capacity planning potential. You can monitor your capacity availability by CPU, memory, disk I/O, and network utilization. This allows you to plan for the future in all facets rather than a limited perspective. By taking into account all these features you can make sure that you don’t run into problems.
ManageEngine Applications Manager is a tool that provides one of the most comprehensive server monitoring experiences on this list. ManageEngine Applications Manager is available from a price of $945 (£722) and up. There is also a 30-day free trial which you can download from this link here.
6. Nagios XI

Nagios XI is a network monitoring tool that has a full range of infrastructure monitoring features as well. One of the first things you’ll notice about Nagios XI is that the design of the user interface is quite old fashioned. That being said it is easy to see the health of your infrastructure as everything is color-coded. With regards to server monitoring there are over 3500 add-ons that you can use to help monitor your servers.
With Nagios XI you can monitor Windows, Linux, Unix, Mac OS, Solaris, AIX and HP-UX servers. One particularly useful feature is that of capacity planning graphs. With capacity planning graphs you can plan for when you will need to upgrade your servers in the future. This keeps you one step ahead and makes sure that you don’t end up reaching full capacity and falling victim to downtime.
This product also has a range of Configuration Wizards that can help you to configure your network monitoring environment. This eliminates the need to spend time creating manual configurations. There are Configuration wizards for servers like Linux, LDAP, Mail, and Exchange. This is great for assisting newer users through the setup process.
Nagios XI performs well as both a network monitoring tool and a server monitoring product. Nagios XI is available from $1,995 (£1,526) on Windows, Linux and VMware. However, if you want to make use of features such as capacity planning and scheduled reports you will need to download the Enterprise Edition for $3,495 (£2,674). You can also download a free trial from this link here.
7. Ipswitch WhatsUp Gold

Next up we have WhatsUp Gold. Ipswitch’s WhatsUp Gold is a tool that has gathered a following based on its network monitoring ability. However, its infrastructure monitoring capabilities make it an ideal tool for server monitoring as well. You can view the health of devices throughout your network, and include up and down status from a dashboard of your choice. You can even create dashboards tailored towards individual users.
Autodiscovery on WhatsUp Gold is a very useful feature. With autodiscovery WhatsUp Gold automatically recognizes devices throughout your network (including servers) and connects them to your monitoring environment. This simultaneously creates a network topology map showing you where all your devices are geographically located in relation to each other. Having a topology map is useful because it provides you with another perspective to conduct quality of service monitoring.
WhatsUp Gold has a number of add-ons which can be used to increase the platform’s basic function. Many of these add-ons can be used to assist your server monitoring efforts. For example, the Application Performance Monitoring add-on allows you to monitor web servers, mail servers and databases. There are a ton of Whatsup Gold add-ons which can be downloaded from the Ipswitch website.
One of the reasons we recommend WhatsUp Gold is its alerts system. WhatsUp Gold uses a customizable alerts system that allows you to dictate how you’re notified once a predefined threshold is breached. You can be notified via email, SMS and Slack. You can also instigate service restarts in the event that a service falls apart. WhatsUp Gold has its own thresholds configured out of the box so that you don’t have to spend time manually configuring alerts before you use this function.
WhatsUp Gold is available on a subscription or a license basis. On both the Premium subscription and license you get network and server monitoring, autodiscovery, performance monitoring, alerts, and customizable dashboards. However if you want to use network traffic analysis, application monitoring, and virtualization monitoring you need to purchase the Total Plus license. You need to contact the sales team in order to view the price of this product. There is also a free trial which can be downloaded from this link here.
8. Monitis
Finally we have Monitis. Monitis is a server monitoring tool that is offered as a cloud service. This product has been designed to focus on the health of connected servers. It has agents for both Windows and Linux making it suitable for cross-platform environments. It can check the health, CPU, memory and storage of servers every minute. It can also monitor network bandwidth.
In terms of wider monitoring ability, Monitis has support for a variety of protocol including SMTP, UDP, IMAP, POP and SIP. The majority of your monitoring activity is done through the system dashboard. You can access this as a web-based GUI which can be customized according to your needs.
It is worth noting that you aren’t limited to the default features of Monitis either. There are a range of additional plugins that add additional features to the mix as well. These include minor modifications and visual changes to upgrades and scripts. Plugins give administrators the opportunity to build the monitoring environment that they want to see.
In terms of pricing, you only pay for the amount of users and servers you wish to monitor each month. The factors that go into your monthly/yearly rate vary based on a number of factors. These include uptime monitors, real user monitoring, full page load monitors servers, application monitors, custom monitors, and security monitors. There is a 20% reduction if you subscribe to the annual plan. There is also a 15-day free trial that can be downloaded from this link here.
Top Server Monitoring Tool: SolarWinds Server and Application Monitor
Based on its ease of use and extensive performance monitoring templates, SolarWinds Server and Application Monitor is our top pick. The centralized perspective offered through this program and the AppStack dashboard is everything you would expect from a server monitoring tool in this price range. While there are many network monitoring tools that can stand in as a server monitor, SolarWinds Server and Application Monitor has been expressly designed for this purpose.
Whether you choose to go for SolarWinds Server and Application Monitor or not, we recommend that you pick a tool with alerts. This will help to minimize your manual administration responsibilities and allow you to keep up with problems as they occur. Without alerts you are likely to struggle to keep on top of every important change.
Implementing server monitoring is the key to ensuring effective capacity planning. These are key resources in your network and if a key server goes down then you’re going to run into big problems. Investing in the right platform will make sure that you don’t incur unexpected costs further down the road.