The New Windows 8 Task Manager TM.exe
Microsoft has redesigned the Windows 8 Task Manager; they have pulled off the rare trick of providing more information, yet making it easier to see what’s happening with underlying processes.
Windows 8 Task Manager Topics
- Improved Task Manager Features
- Windows 8 Task Manager Performance Tab
- Windows 8 Task Manager Services
- How to Set Priority in Windows 8
- Using the Taskmanager to Close Apps
♦
Windows 8 Task Manager Commands
Good news, the old keyboard tricks still work in Windows 8, so you can launch the new Windows 8 Task Manager with the command: Ctrl +Shift +Esc. If that 3-key combination does not work, you could revert to the Metro-style UI and hit ‘t’ on your keyboard; Task Manager should appear amongst the Apps beginning with ‘t’.
If none of these techniques work, it could be a virus that is preventing task manager launching. Plan B try gpedit or regedit and check if the task manager has been disabled.
Improved Task Manager Features
The Windows 8 task manager has been given a make-over. Not only has the name of the executable been changed from taskmgr.exe to tm.exe, but also the interface now displays the process information in columns. The second new feature to note is the way processes are grouped, starting with ‘Applications’ followed by ‘Background processes’. See screenshot below.
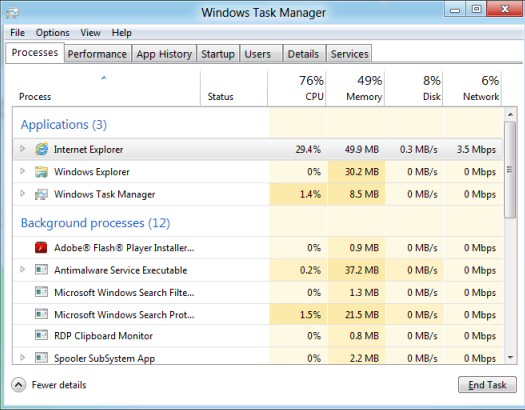
One reason for going to the Processes tab is to check the location of suspicious executables. I realize that the Windows Task Manager itself is a well-known program, however, you can use it as a vehicle to right-click then check ‘Open File Locations’, now you can see the path: C: \Windows\System32\TM.exe.
Analyze Wait Chain
If you find a process with ‘Status suspended’; you can right-click (this or any other process) and troubleshoot. One option to find out more about hanging programs is ‘Analyze wait chain’, however, you only get this option to spot deadlocks if you right-click a process in the Details view.
As the name implies, Analyze wait chain tree shows which processes are using, or waiting to use, a resource that is being used by another process. Previously, I had only seen this Analyze Wait Chain in Resource Monitor, but here it is the Windows 8 Task Manager.
Windows 8 Task Manager Performance Tab
It’s easier than ever to monitor the big 4 performance resources: CPU, Memory, Disk and Network (Wireless and Ethernet). In particular the performance tab is a great place for gaining insights into processes hogging memory or CPU usage.
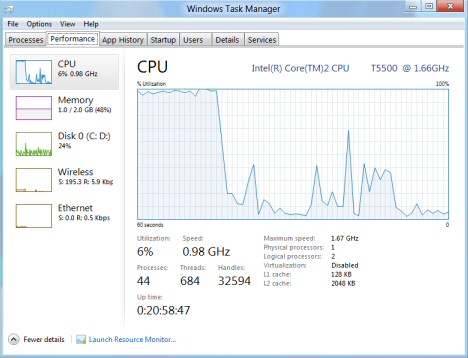
Note: Information from the Windows 7 Networking tab is now incorporated in the Windows 8 Performance tab.
Guy Recommends: SolarWinds’ Log & Event Management Tool
LEM will alert you to problems such as when a key application on a particular server is unavailable. It can also detect when services have stopped, or if there is a network latency problem. Perhaps this log and event management tool’s most interesting ability is to take corrective action, for example by restarting services, or isolating the source of a maleware attack.
Yet perhaps the killer reason why people use LEM is for its compliance capability, with a little help from you, it will ensure that your organization complies with industry standards such as CISP or FERPA. LEM is a really smart application that can make correlations between data in different logs, then use its built-in logic to take corrective action, to restart services, or thwart potential security breaches – give LEM a whirl.
Download your FREE trial of SolarWinds Log & Event Management tool.
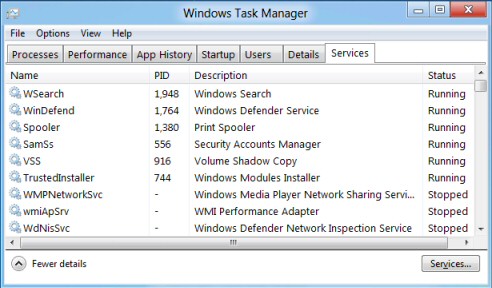
Windows 8 Task Manager Services
The ‘Services’ tab is a welcome addition to the Windows 8 Task Manager, I like to sort on the Status column and discover which services are actually running.
Windows 8 Task Manger Comes to My Rescue
While experimenting with the shell command in the registry, I made a mistake which resulted in Windows 8 booting not into explorer, but into a black screen.
Thanks to CTRL +Shift +Esc I was able to launch task manager, from there it was a trivial job to click: File (Menu) –> Run new task, and type 'Regedit' (or Explorer).
Windows 8 Task Manager New Start-up Tab

Start-up is another new tab in the Windows 8 Task Manager. One new feature is Start-up impact.
- High impact – Apps that use more than 1 second of CPU time or more than 3 MB of disk I/O at startup
- Medium impact – Apps that use 300 ms – 1000 ms of CPU time or 300 KB – 3 MB of disk I/O
- Low impact – Apps that use less than 300 ms of CPU time and less than 300 KB of disk I/O
Note: It's not possible to speed-up the boot process by setting your programs to low impact. Remember, the impact is a measure of how that program's actions are affecting the start-up process.
Although you can examine and remove programs that have bullied their way into a users Startup folder, Msconfig is still available for a more comprehensive analysis of what should happen before the New UI initializes. See more on MSConfig.
Use the Windows 8 Task Manager to Launch Programs
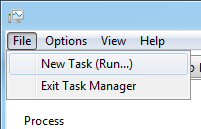
Sometimes the old tricks are the best; under pressure from absorbing new stuff I tend to forget faithful old techniques such as using the task manager to Run programs. This is particularly useful in the new Metro UI if you haven’t pinned the run command to the Metro UI.
Click on File (menu) select: New Task (Run …). Naturally, type the name of the executable, for example, I once lost the Windows shell so I typed explorer. On another occasion I wanted to check a registry setting so I launched regedit using this technique.
Task Monitor ‘Hot Spots’

For multiple processors a colour gradation is easier to digest usage than lots of individual traces.
The heat map comes into its own with large numbers of logical processors. If your Windows 8 machine approaches the maximum 640 logical processors then the scroll bar appears.
Windows 8 Set Affinity

Advanced Technique – Set Affinity. This is a high risk, high reward strategy. The more 'logical processors' you have the better the chance that this performance tweak will be effective. The problem is that it may make your machine run slower.
Orientation: Launch Task Manager, select the Details tab, right-click a process such as SearchIndexer, Set Affinity and choose one or more processors. It may have already occurred to you that even if this tip is not suitable for the SearchIndexer it may be worthwhile for other Windows processes.
Guy Recommends: A Free Trial of the Network Performance Monitor (NPM) v11.5
v11.5
SolarWinds’ Orion performance monitor will help you discover what’s happening on your network. This utility will also guide you through troubleshooting; the dashboard will indicate whether the root cause is a broken link, faulty equipment or resource overload.
What I like best is the way NPM suggests solutions to network problems. Its also has the ability to monitor the health of individual VMware virtual machines. If you are interested in troubleshooting, and creating network maps, then I recommend that you try NPM now.
Download a free trial of Solarwinds’ Network Performance Monitor
Task Manager App History

The third tab displays the CPU time and metered network usage for each of your Windows 8 Apps.
It's also possible to reset the usage.
One of the bonuses of this tab was to get a listing of all the apps that I had downloaded. The screenshot shows the apps sorted by CPU time.
Saving Windows 8 Task Manager Settings
If you close the Task Manager gracefully it saves your settings. However, if the operating system crashes you lose the configuration changes you made.
A little research reveals that Windows 8 Task Manager stores configuration data here:
HKCU\Software\Microsoft\Windows\CurrentVersion\TaskManager.
As Task Manager launches it bizarrely deletes the current configuration, and then saves it to the registry when the application exits gracefully.
The problem occurs if Task Manager exits without saving data for example, with a forced shutdown, or an operating system crash; in these circumstances the configuration is lost.
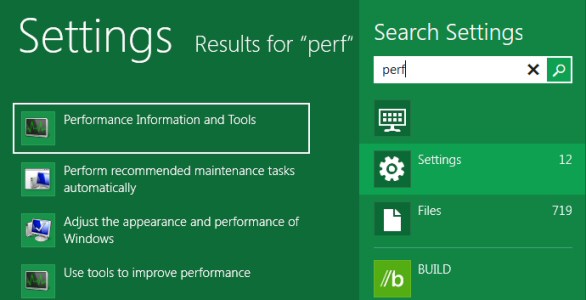
Windows 8 Performance Monitor
Finding the Windows 8 performance monitor is not easy. The traditional method is to start at the Control Panel, however, the Performance Monitor is hidden away at the bottom of the System section, Performance Information and Tools.
The new Metro start screen foxed me; when I pressed ‘p’ for performance, no icon appeared. However, as soon as I clicked on Settings, there was the Performance Information and Tools.
See more about Windows 8 performance monitor »
Summary of Windows 8 Task Manager
You can launch the Windows 8 Task Manager with Ctrl +Shift +Esc, or else find tm.exe. Once it initializes, check out the new tabs such as Startup and Services.
If you like this page then please share it with your friends
Microsoft Windows 8 Troubleshooting Topics
• Windows 8 Overview • Win 8 Event Viewer • Windows 8 Shutdown • Windows 8 Join Domain
• Windows 8 Performance Monitor • Windows 8 PowerCfg -Energy • Windows 8 Sleep Problems
• Windows 8 Troubleshooting • Windows 8 Sound Problems • Win 8 Server Admin Tools • Tookit