A decade ago, avoiding complete breakdown was the focus of IT departmental effort but today, merely a slowdown in traffic can cause financial harm.
The importance of network monitors has not gone unnoticed by commercial software producers. The market for these tools is now very crowded and testing all options would take up more time than any network manager has to spare.
There is plenty of detail on each tool below, but if you only have time for a quick glance, here is our list of the eight best network monitoring tools:
- SolarWinds Network Performance Monitor (FREE TRIAL) The premium network monitor that runs on Windows Server.
- Paessler PRTG Network Monitor (FREE TRIAL) A three-in-one infrastructure monitor for Windows Server.
- NetCrunch Monitoring Suite An all-in-one network monitoring package that includes SNMP alerts and traffic flow analysis.
- ManageEngine OpManager A comprehensive network monitor for Windows and Linux.
- Zabbix A free network monitoring system for Linux, Mac OS, and Unix.
- Nagios XI A paid network monitor for Linux and Windows with a free version.
- Icinga A free, open source network monitor for Linux.
- Spiceworks Network Monitor A free, ad-supported network monitor for Windows.
The functionality of each network monitor on offer is not identical. There is a core requirement of these tools to keep a check on the statuses of network equipment; however, the tracking of traffic types and the monitoring of surges and lulls is also important for those who want to squeeze the most value out of an IT infrastructure budget.
Graphical data interpretations can reveal problem areas very quickly, but the managers of smaller networks might not face the extensive complexity that the more expensive tools with their attractive, color-coded charts and graphs provide.
The best network monitoring tools
In order to save you time on your quest for a new network monitoring system, we have compiled a list of the eight best network monitoring tools on the market today. You will see that we have picked the “best of breed” that will suit networks of different sizes, for companies with different budgets and divergent network management priorities.
You can read details about these options in the following sections.
1. SolarWinds Network Performance Monitor (FREE TRIAL)
 SolarWinds is the leading producer of network monitoring tool and the Network Performance Monitor is the company’s star product. This software runs on Windows Server.
The Simple Network Management Protocol (SNMP) is central to the operations of the monitor. This system requires an agent program on each network device to respond to status response requests sent out by a central manager. The SolarWinds software acts as that manager, while all network devices have SNMP agent software installed on them by their manufacturers as a standard feature.
The SNMP status request procedure provides the Network Performance Monitor with an autodiscovery system – that means you don’t have to register your network equipment for tracing because the SolarWinds software does that for you. The monitor uses this initial sweep of the network to compile a network topology map.
As well as routine statuses getting reported in the dashboard, the SolarWinds system handles alerts sent out by the SNMP device agents in urgent situations. These alerts appear in the dashboard and also get interpreted into the color-coded graphics in the management screens. It is possible to create your own alert conditions by setting up warning performance thresholds or combining existing alert conditions. You can nominate that alerts get forwarded as notifications by SMS or email.
The dashboard contains some great data visualizations, which are color-coded, so you get instant problem awareness. The console can be customized, enabling you to set up different views and controls for user groups – making this a great tool for a team of administrators. Another bonus is that you can try out the SolarWinds Network Performance monitor on a 30-day free trial.
2. Paessler PRTG (FREE TRIAL)
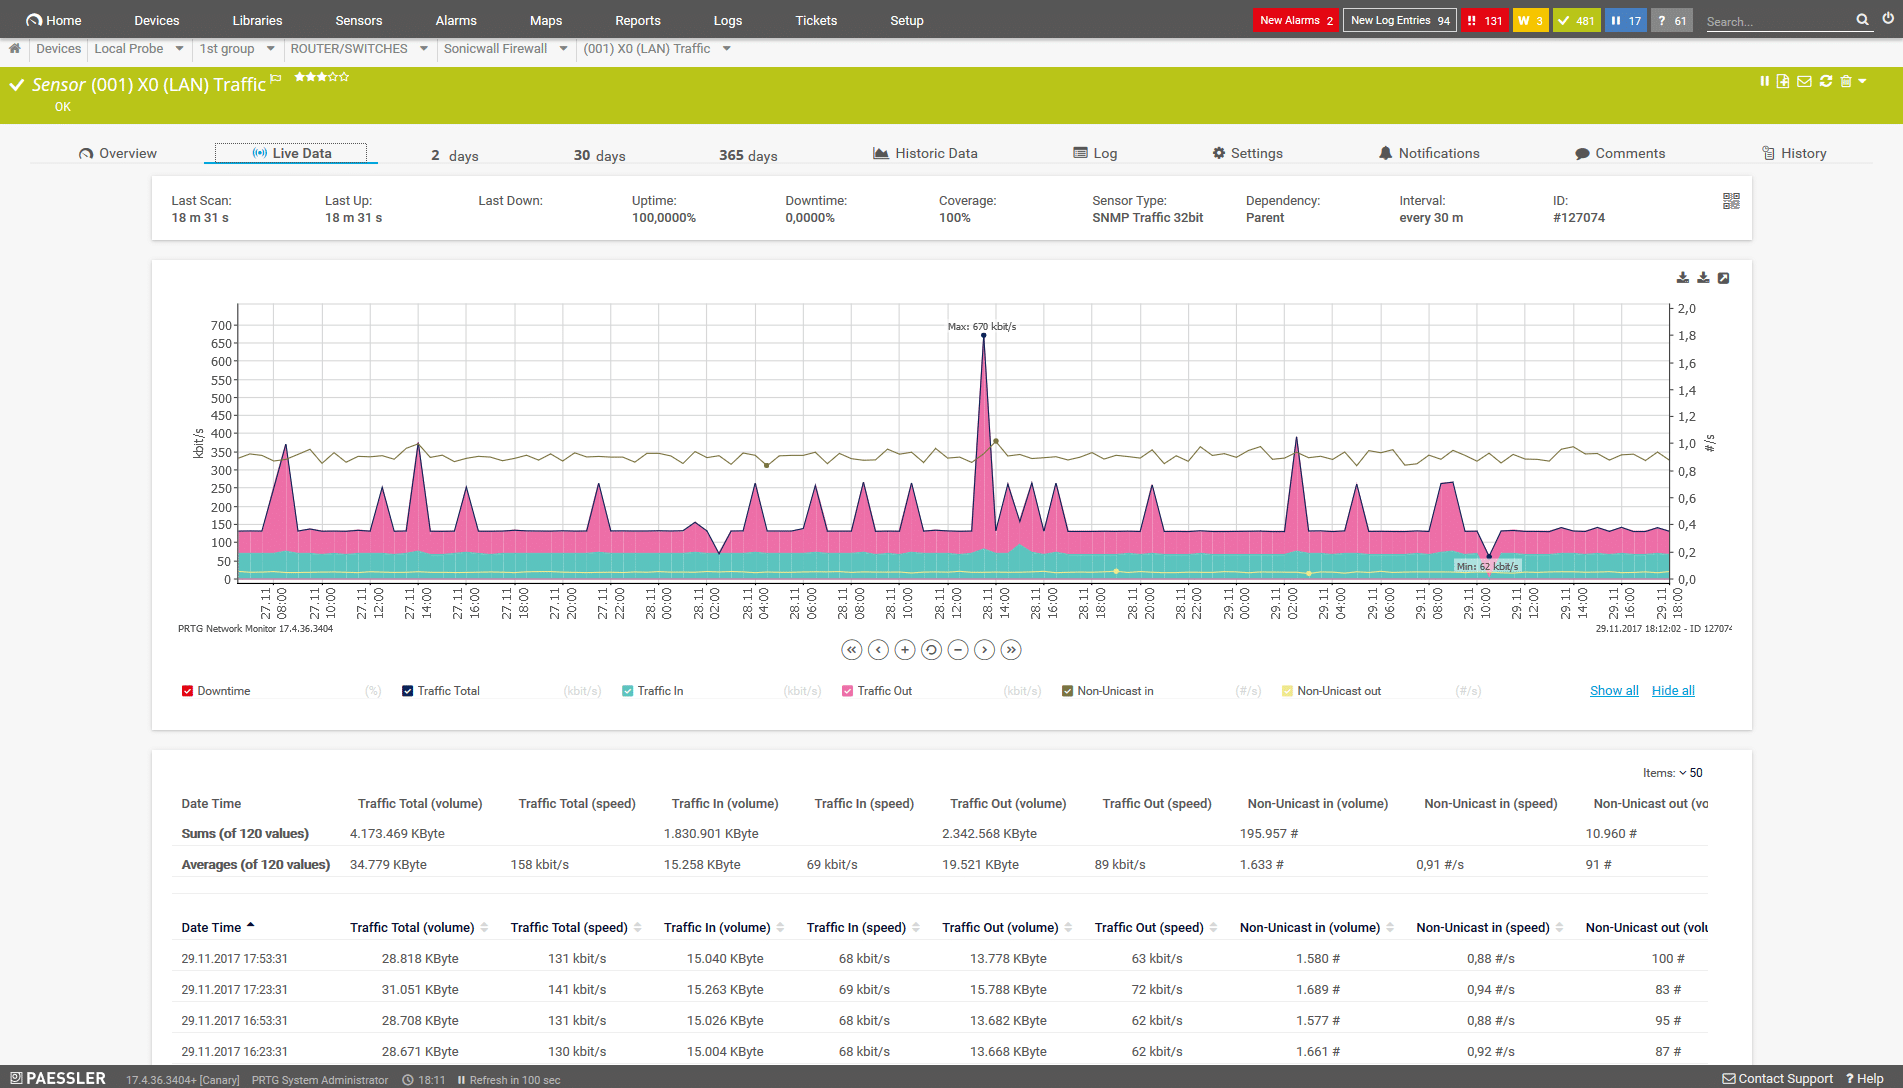 PRTG is an extensive infrastructure monitoring system. The package is made up of a series of functions, which are called “sensors.” The company ships the entire package to all of its customers. You then tailor the system by only activating the sensors that you need. The system is charged for in bands of sensor numbers and if you only activate up to 100 sensors, you can use the software for free.
The entire PRTG system monitors networks, servers, and applications. If you need a network monitor, you just activate those sensors relating to networks. This flexibility makes the PRTG very scalable and it would be of interest to a wide range of organizations.
The most important sensor in the pack uses SNMP procedures to monitor the health of network equipment. This feature gives you an autodiscovery function and a network mapping utility. The PRTG dashboard processes SNMP alerts into on-screen notifications, which can be forwarded as SMS and email notifications.
Other useful sensors include Ping and Traceroute, a packet sniffer, and sensors that pick up NetFlow, sFlow, and J-Flow messages to track network traffic volumes.
The monitoring system is able to trace the components of virtualizations as well as monitoring LANs. It can track the performance of wireless networks and remote systems, including Cloud-based resources.
The dashboard includes some great data visualizations that are color-coded. It is possible to customize the dashboard and create different versions for team members.
PRTG installs on Windows Server and you can take it for a spin on a 30-day FREE trial.
3. NetCrunch Monitoring Suite

NetCrunch Monitoring Suite is a product of Adrem Software. The company produces four levels of network monitoring systems, with NetCrunch Monitoring Suite being the highest of these products. The Monitoring Suite is a complete infrastructure management system because it includes hardware and software inventory management and also server, application, and virtualization monitoring.
The network monitoring system is based on SNMP, so you get regular check ups on all of your network devices to make sure that they are all in working order. SNMP traps alert you to any sudden status changes, so you can react to network problems before the users spot them.
The package also includes network traffic flow monitoring systems. The console can communicate with devices using the IP-FIX, NetFlow (v5 & v9), sFlow, JFlow, netStream, cFlow, AppFlow, and rFlow protocols. The data flow information gleaned from your network equipment is displayed live on the screen and can also be stored for assessment through the built-in analyzer.
The visualization in the package are outstanding and they include a network topology map and end to end routing plans. The console also displays dependencies, which is particularly useful if you implement virtualization.
Extra system help comes in the form of log file monitoring and forwarding. This element is particularly important for intrusion detection. The log monitor can handle Syslog and Windows Event messages and also log records generated by Apache Web Server.
The main processing engine of NetCrunch installs on 64-bit Windows Server. You can either install the console software on Windows computers, or deliver it from your server as a browser-based app. You can get a 7-day free trial of all of the monitoring software without even registering on the Adrem website. However, if you do register your contact details on the site, you are allowed a 30-day free trial of all Adrem software.
4. ManageEngine OpManager
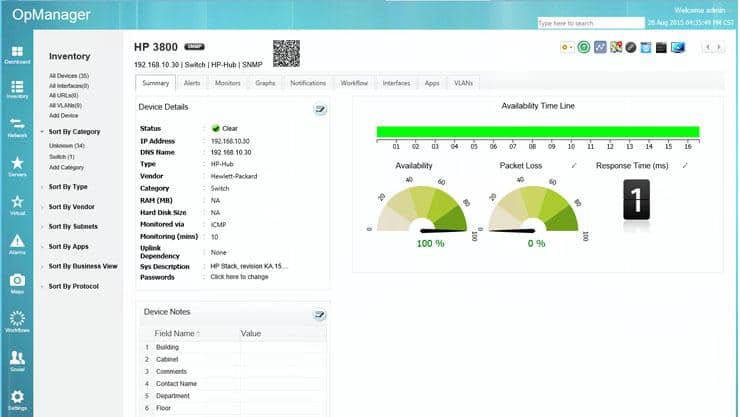 OpManager is an impressive network monitor that uses SNMP procedures to keep track of the statuses of network equipment. The package also includes server monitoring functions. The software for this monitor will run on Windows and Linux.
The tool includes an autodiscovery function that will also generate a map of your network. The mapping options of this monitor are really impressive. You can get your WAN plotted on a map of the world, a standard device connection topology plan of your network, and you can even get your equipment laid out on a floorplan of your offices and see the racks in each server cabinet.
You get an attractive, customizable dashboard with this monitor. It shows live performance data in color-coded graphical features, such as charts and graphs. The console also shows any alerts that arise from device agent notifications. Those alerts can be forwarded to key staff via SMS, email, or chat app. You can also set up your own customized alert conditions. The tool includes apps for mobile devices, so you and your team can keep in touch with the monitor when out in the field.
The monitor is able to track the supporting infrastructure of virtualizations and its visibility extends to remote sites and Cloud-based resources. There is a free version of OpManager, which doesn’t include those VM and remote resource monitoring features. Another limitation on that edition is that it will only cover up to 10 devices. There are two paid versions of the tool with the higher version including failover processes. You can access the full edition of OpManager on a 30-day free trial.
5. Zabbix
 Zabbix is a free monitoring tool that installs on Linux, Unix, and Mac OS – monitoring agent software can be installed on Windows. The monitor tracks the health of network devices and includes an alert mechanism. The dashboard for the tool is very well presented and includes color-coded graphics. The monitor tracks alerts, displaying them in the dashboard and also sending them on by SMS, email, or chat app.
The monitoring capabilities of this tool include networks, servers, and applications. It is able to track connections to remote resources, including Cloud services. It can give you full monitoring capabilities on remote sites. All communications between the remote data collectors and the central managing program are encrypted for safe transmissions across the internet.
An impressive feature of Zabbix is the ability to set up action scripts that can be triggered by alerts. These can be used to gather further information about a problem or even take steps to solve problems or isolate troubled equipment.
Surprising features of this monitor make it suitable for use by managed service providers. These are utilities such as service level agreement tracking and auditing.
6. Nagios XI

Nagios XI has a very large user community that supports each other through a special forum and also makes add-ons available for free. This is a paid tool that is based on the free, open source Nagios Core. Both versions run on Windows and Linux.
The basic Nagios XI is able to monitor networks, servers, and applications, but it can be extended almost infinitely to cover a very long list of functions thanks to the thousands of add-ons available for the tool.
The reports section of the tool covers live and stored data for network statuses, alerts, bandwidth usage, and event log messages. The tool can be used by MSPs to manage the networks of clients thanks to its multi-tenant account set up options. The monitor is available in two editions: Standard and Enterprise. Extra features in the Enterprise edition include capacity planning and auditing.
You can get a 60-day free trial of Nagios XI. Companion tools for the network monitor include the Nagios Network Analyzer and Nagios Log Server.
7. Icinga
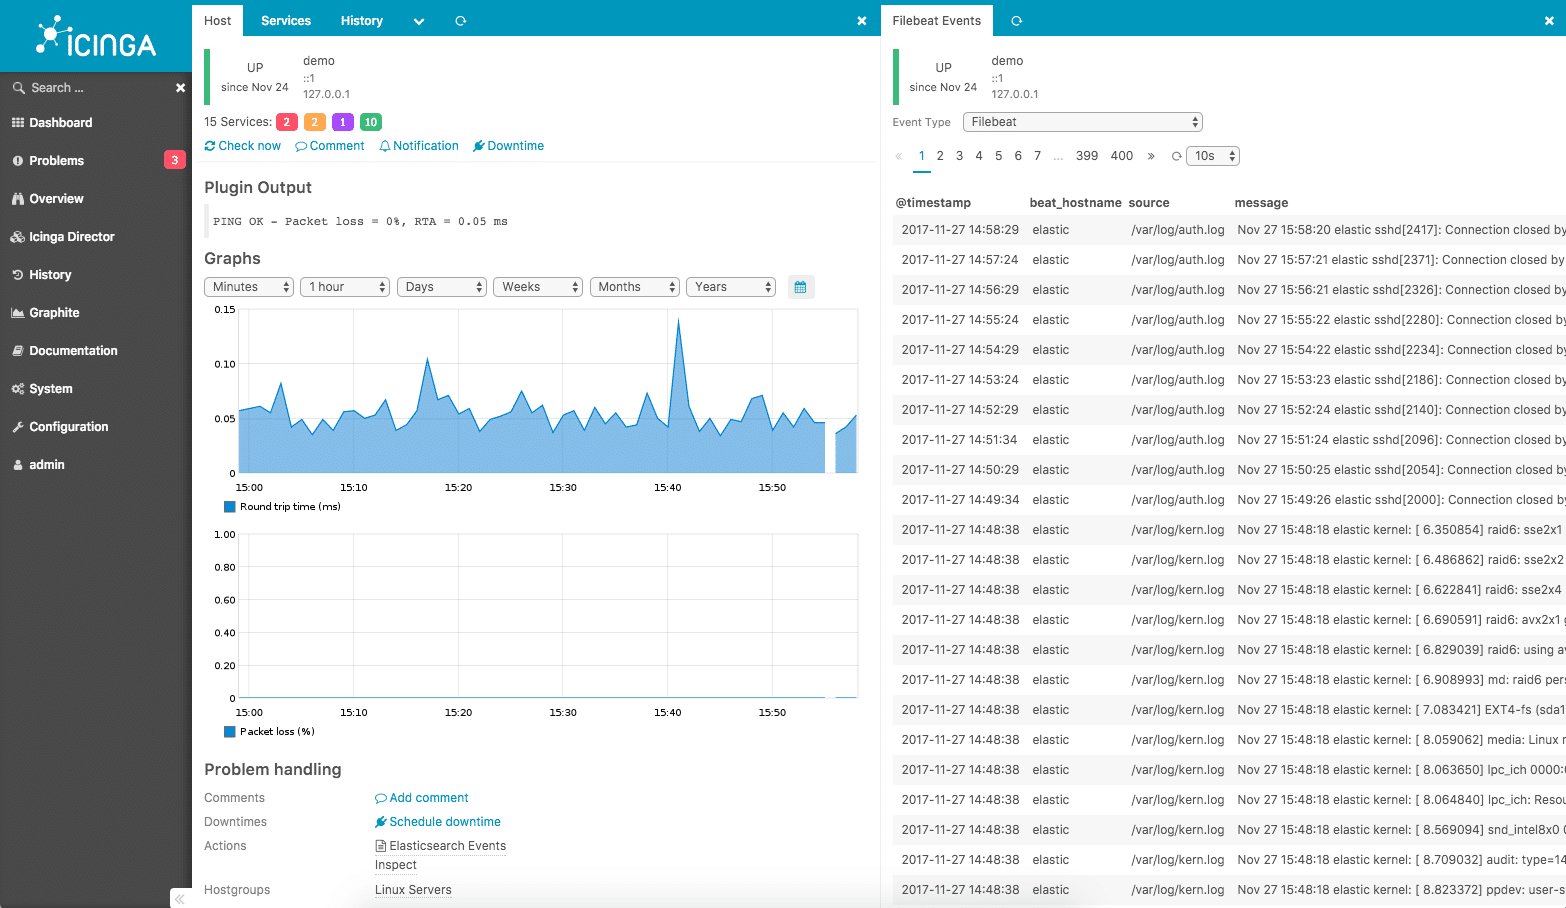
Known by its current version number, Icinga 2, this monitoring tool was originally created from a clone of Nagios Core. The two tools have diverged since that initial starting point. This utility is free to use and the software is open source. That means that anyone can access the programs and adapt them if they like. This option would give you the ability to create a custom network monitoring tool for your business.
As well as monitoring networks, this tool will monitor servers and can categorize traffic by application/protocol. The basis of the network monitoring system is SNMP. This includes the urgent notification mechanism, called a “trap” which gets converted in the Icinga 2 system as an alert. These are shown in the dashboard, but can also be forwarded by email or SMS.
The software for Icinga 2 installs on Linux or Unix. The architecture uses a multi-thread model, which means that the work carried out by the system can be distributed across a series of processors. Communications are protected by Transport Layer Security.
As it is based on Nagios Core, the add-ons that are produced by the Nagios community can also be used to extend Icinga 2. This system monitor includes SLA auditing and tracking functions, with some improvements over the Nagios procedures. The major advantage that Icinga 2 has over Nagios Core is that it has an attractive and extensive user interface.
8. Spiceworks Network Monitor
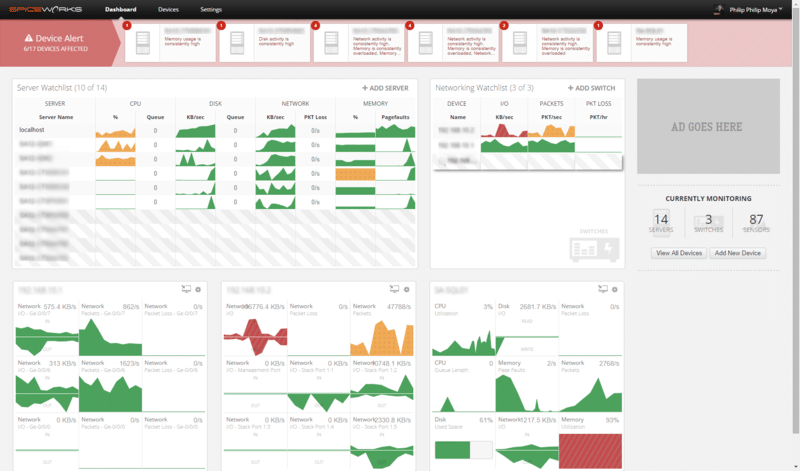 Spiceworks Network Monitor is a free utility that is funded through ads displayed within the interface. The software runs on Windows and is part of a suite of infrastructure monitoring tools that include Spiceworks Help Desk software, Spiceworks Inventory, and Spiceworks Network Mapper.
Unusual for a free tool, the Network Monitor is fully supported by a help desk, which is also free to access. The tool isn’t aimed at large networks but is intended for systems that include 25 devices or less. The user community communicates through a forum, giving you another channel for tips and tricks.
The procedures of the tool are based on the SNMP system and this includes an autodiscovery phase on installation. The Spiceworks Network Monitor also incorporates SNMP traps into alerts, which are shown in the dashboard and can be sent out as email notifications. It is possible to create your own custom alerts from performance thresholds.
The dashboard is simple and well laid out. It includes color-coded data representations, such as graphs and charts. You will be able to check on the capacity and speed of your network devices and get that information categorized per applications.
Selecting a network monitoring tool
All of the tools in this list are appealing and work well for the right market niche. Your next task will be to narrow down your options.
The operating system of your available server is an important consideration when you choose a network monitoring tool. If you have a Windows server, then your options are:
- SolarWinds Network Performance Monitor
- Paessler PRTG
- ManageEngine OpManager
- Nagios XI
- Spiceworks Network Monitor
- WhatsUp Gold
If all of your servers run on Linux, then your choice comes down to:
- ManageEngine OpManager
- Zabbix
- Nagios XI
- Icinga
If you are a small business with a relatively straightforward network, then one of the free tools on our list would probably attract your attention. The Spiceworks Network Monitor, for example, was specifically written to suit small networks. The existence of user communities for advice that is accessible for the users of Nagios XI and Spiceworks will help you get up to speed in how to get the best out of the tool.
Larger businesses should invest in the security of one of the more comprehensive, supported paid tools on our list. The scalability of Paessler PRTG recommends the tool for growing middle-sized companies. That system is also a good choice for very large companies with complex hybrid networks. In the top division, PRTG competes with the ManageEngine OpManager and SolarWinds Network Performance Monitor, which is the industry leader.
Once you have narrowed down your selection by an operating system and network size suitability, you will be down to just a couple of options. As many of the tools on this list are free to use and the paid tools offer free trials, your final step in the selection process will be to install your final candidates and give them a go.


