Introduction to Windows Server Task Manager
Do not neglect Windows Server 2008 or 2003’s Task Manager. There will be occasions when you just need a quick piece of system information, calling for your task manager can be just as effective as the performance logs but much faster.
![]() Execute the Task manger by holding down the CTRL +SHIFT +ESC keys; if you have long fingers, try launching it with just your left hand. (As ever Microsoft provide 3 ways of doing everything, so you can right-click the grey bar at the bottom of your screen and select Task Manger.)
Execute the Task manger by holding down the CTRL +SHIFT +ESC keys; if you have long fingers, try launching it with just your left hand. (As ever Microsoft provide 3 ways of doing everything, so you can right-click the grey bar at the bottom of your screen and select Task Manger.)
Topics for Task Manager in Windows Server
Each of the five tabs has it’s own personality, I recommend that you get to know the capabilities of each one. An application tab for zapping programs, a process tab for checking for viruses, a performance tab to calculate the pagefile, and now a network utilization tab to see how much activity there is on the LAN or WAN.
- Applications Tab
- Processes Tab
- Performance Tab
- Networking Tab
- Thousand Separators
- Users Tab (Workgroup)
- Task Manager Trap
- Task Manager Alternative – PowerShell
- Windows 8 Task Manager (TM.exe)
♦
Applications Tab
No doubt you have already used task manager’s Application Tab to end process for programs that hang or do not respond. Assuming that your group policy allows users access to this tab, why not send out an email reminding users of how to use this Applications tab when their machine hangs and programs are ‘Not Responding’.
Another use of the Applications Tab is to discover the underlying Image Name of a program, simply right-click and then select: Go to Process.
Tip: One of the joys of using any new program is setting the preferences. With Task Manager I like to remove the tick which says ‘ Always on top’. (Option Menu).
Processes Tab
Here is a tab for the support professional, in fact the more ‘Image Names’ that you can identify the better techie you are.
The more of these Image Names that you can match to programs or processes, the easier it is detect impostors such as viruses. Moreover, by identifying the ‘good guys’ you will learn how applications such as Exchange and SQL interact with the operating system.
At first svchost seems suspicious. Could you have been infect 7 times by a strange virus? No, svchost is the generic name for an image shared by the operating systems services, for example, Alerter, Net Logon, Print Spooler. The interesting fact about all these svchost is that some services would fight if put together in the same Image Name process, so the operating system separates incompatible services and puts them in separate svchosts.
Returning to the theme of identifying rogue programs; what would think if you saw Avgserv and Agvcc32 amongst the image names? When I saw these processes, I must admit my heart missed a beat. At first I thought my machine has been infected by a virus, but no, it was actually my virus checker which had installed itself as a process. Naturally I left that running!
How about msblast.exe? Was this a game that my nephew had installed? Well I tried a search in Google and up came W32/BlasterA virus. Here was a case where I needed to check the registry as the blaster virus cunningly re-infects those who are not diligent. Other viruses have more innocuous names like Tlntsvr.exe and Wina.exe, so this is why I urge you to know the Processes Image names.
View Menu, Select Columns
When using the Processes tab to troubleshoot be aware that you can add extra columns, for example Virtual Memory, IO Reads and Writes. Again my idea is to use the Task Manager to display information quickly without resorting to setting up the System Monitor and Log Counters.
Adjust Priority, Set Affinity
If you right-click any process then you can adjust Priority, typically you have a spreadsheet calculating in the background while you want to give a foreground application like Outlook more CPU time slices. Note, never set programs to Real Time, it will cripple your machine and require a reboot – you have been warned.
Affinity means that one program can be associated exclusively with one processor, naturally you need a multi processor machine for this setting to even appear. In truth, Affinity is a case of ‘Mother knows best’. Guy says leave alone, unless someone has got in before you and incorrectly set affinity, leave it to the operating system.
Performance Tab
My main use of this Tab is to check memory. In particular to check on the pagefile. Now I have read many articles about how big to set the page file. Experts say use RAM x 1.5 whilst others say RAM x 2. Guy says suck it and see. By that I mean compare two figures: Commit Charge (K) Limit with Peak. You may have already guessed that the Commit Charge (K) is the sum of RAM + Pagefile
In Diagram 2 the Limit is 1280032
Whilst the Peak is 617564. My interpretation is that this machine has a big enough page file. However if the Peak was 1MB (1000000), then I would declare that the pagefile was not big enough and take action in the System Icon. If the Peak was below 400000 and I was desperate for the disk space, then I would even reduce the pagefile.
Guy Recommends: A Free Trial of the Network Performance Monitor (NPM) v12
v12
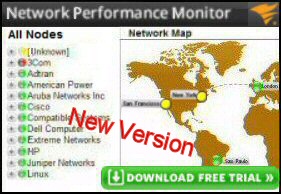
SolarWinds’ Network Performance Monitor will help you discover what’s happening on your network. This utility will also guide you through troubleshooting; the dashboard will indicate whether the root cause is a broken link, faulty equipment or resource overload.
Perhaps the NPM’s best feature is the way it suggests solutions to network problems. Its second best feature is the ability to monitor the health of individual VMware virtual machines. If you are interested in troubleshooting, and creating network maps, then I recommend that you give this Network Performance Monitor a try.
Download your free trial of SolarWinds Network Performance Monitor.
My Pet Hate – No Commas
Jimmy May kindly wrote in showing me how to hack the registry and turn-on the thousand separators. This is how you do it:
Turning On Thousands Separators in Perfmon
Turn on thousands separators (commas or periods, depending on your locale) in Perfmon to make large numbers much easier to read.
[HKEY_CURRENT_USER\Software\Microsoft\SystemMonitor]
"DisplayThousandsSeparator"=dword:00000001
Turning Off Vertical Bars in Perfmon Charts
When a perfmon log contains many sample points, it may collapse multiple samples into a single point on the X axis, and graph a vertical bar that represents min/max/avg for the collapsed samples. This can be a useful feature, but it can also make the graph hard to read (trends are harder to discern) when viewing many counters. You can set the following registry value to turn off the vertical bars:
[HKEY_CURRENT_USER\Software\Microsoft\SystemMonitor]
"DisplaySingleLogSampleValue"=dword:00000001
Leaky Memory
Keep your eye on Kernel Memory, Nonpaged. These days servers need rebooting less frequently, if you have a ‘leaky app’ then Nonpaged memory will creep up over time. Confirm any suspicions with View, Select Columns, Non-Paged Pool.
Networking Tab
This is great utility to view network utilization. This is a new Task Manager interface in XP and Server 2003. In fact it is difficult if not impossible to create performance logs to measure % Network utilization.
Users Tab 

Call me a ‘Luddite’ but I have never had much use for this tab on my Windows 2003 Server. When I want to check on users connected to the server, I prefer the Shared Folder snap-in.
Another reason that I do not use the Users Tab is that with XP you only see this machine if it’s part of a Workgroup and you are using ‘Fast User Switching’.
Task Manager Trap
When I was a ‘greenhorn, (many, many years ago) I fell into the trap of carelessly double clicking inside Task Manger, as a result the top menu with File, Option, Help disappeared. I could not understand what had happened until I double clicked near the top, and lo and behold the menu reappeared. It was a beginner’s mistake; I mention it because there are about 3 or 4 other Microsoft programs that display the same menu behaviour.
Guy Recommends : SolarWinds’ Free VM Monitor
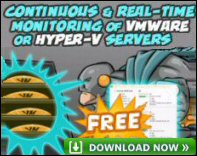
The best feature of this new this new version of SolarWinds VM Monitor is that it checks Windows Hyper-V. Naturally, it still works with virtual machines on VMware ESX Servers. VM Monitor is a clever desktop tool that not only tests that your server is online, but also displays the CPU and memory utilization for each node.
It’s easy to install and to configure this virtual machine monitor, all you need the host server’s IP address or hostname and the logon info. Give this virtual machine monitor a try – it’s free.
Download your free copy of SolarWinds VM Monitor.
PowerShell – An Alternative to To Task Manager
In Windows Server 2008 and Vista, PowerShell gives you more control over the processes, in particular grouping according to Company Name, and printing a list of processes.
# PowerShell script to group by company
get-Process | sort company | format-Table ProcessName -groupby company
See more on PowerShell and Task Manager
If you like this page then please share it with your friends
More Help for Detecting Computer Bottlenecks
Download your eBook: The Art and Science of Performance Monitoring for only $5.25
![]() Learn the secrets of which counters to monitor. Master performance monitor logging, develop your skills with structured exercises and examples. Print out a copy to read, while you design logs and alerts to detect network bottlenecks.
Learn the secrets of which counters to monitor. Master performance monitor logging, develop your skills with structured exercises and examples. Print out a copy to read, while you design logs and alerts to detect network bottlenecks.