Introduction to Disk Bottlenecks on Windows Servers
This page will explain how to use performance monitor to log disk counters. I will also recommend solutions to disk bottlenecks on Windows Servers (2003 or 2008).
Disk Topics
- Basic Disk Counters
- Disk Bottleneck – Queues
- Solutions to Disk problems
- Diskperf -y (New settings in 2003)
- Summary of Disk Monitoring
♦
Disk Monitoring Homily
Firstly, a homily to explain why you should always monitor these ‘big four’ objects: Memory, Processor, Disk and Network. Beware of monitoring one counter in isolation because that can lead to the wrong conclusions.
One company thought they had a problem with slow disks on a Windows 2003 Server. Performance monitor confirmed long queues and slow disk access times. Their conclusion was that the bottleneck was the disk and so they bought faster disks. Unfortunately, the slow response persisted and they called me in to investigate. By monitoring all the ‘big four’ performance objects, I found excessive paging, there was also less than 2MB of available bytes. The true ailment was lack of memory, high disk usage was a symptom and not the cause. The lesson: incomplete monitoring can mean a waste of time and money, so always record these four objects:- Memory, Processor, Disk and Network.
The Windows server roles most likely to experience disk problems are, web servers with lots of graphics and file servers. On the other hand, Domain Controllers, DNS, or DHCP servers are unlikely to have disk bottlenecks
Basic counters to monitor disk activity
PhysicalDisk
- PhysicalDisk: Avg. Read Queue Length Should be less than 2
- PhysicalDisk: Avg. Write Queue Length Should be less than 2
- PhysicalDisk: % Disk Time more than 50% indicates a bottleneck
Disk Bottleneck – Queues 
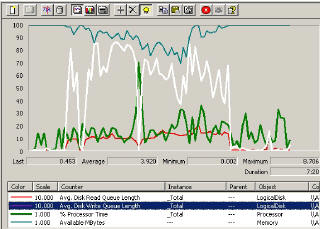
In Diagram 1 performance monitor shows classic symptoms of a disk bottleneck. My diagnosis is based on the Disk write queue counter, you can see that this queue averages more than 2. In fact the average is nearly 4 (with a peak of over 8).
I wanted to to be unbiased. So, to ensure that it was not a processor or memory bottleneck, I also recorded % processor time and available bytes. As you can see from Diagram 1, the processor’s average was below 30%. If the processor were the bottleneck the trace would be over 80%. On the other hand, if there was a memory shortage, available bytes should drop below 10MB. The graph show there was always 70 MB of Available MBytes.
The performance bottleneck may be worse than the average figures above suggest. In Diagram 2, I have legitimately chopped the graph to isolate the period of intense disk activity. For these 5 minutes (4:46) the average is almost 6 against the bottleneck threshold of 2.
The other difference is that in Diagram 2 (taken from performance monitor), I have included % Disk Time, this exceeds 100% for the duration of the trace. In other words, the disk is working flat out writing data to to the hard drive.
There is one more deduction we can make from the queue data on the chart. If you compare the white line with the thick green line near the bottom, you can tell that the disk is writing more rather than reading. To see the diagrams more clearly, double click and expand the thumbnails into larger diagrams.
Guy Recommends: A Free Trial of the Network Performance Monitor (NPM) v12
v12
SolarWinds’ Network Performance Monitor will help you discover what’s happening on your network. This utility will also guide you through troubleshooting; the dashboard will indicate whether the root cause is a broken link, faulty equipment or resource overload.
Perhaps the NPM’s best feature is the way it suggests solutions to network problems. Its second best feature is the ability to monitor the health of individual VMware virtual machines. If you are interested in troubleshooting, and creating network maps, then I recommend that you give this Network Performance Monitor a try.
Download your free trial of SolarWinds Network Performance Monitor.
Solutions to Disk Problems
Defrag your disks
Once disks fill to 70% capacity they slow down dramatically. The other side of the coin is that a defrag can cut queues in half. Incidentally, I am always on the lookout for such cost-nothing solutions.
Starting with Windows 2000, Microsoft has licensed part of Diskkeeper. What you can do is defrag a server drive-by-drive. What you cannot do is schedule a defrag for the middle of the night, neither can you select multiple drives for defragging. So the answer is to get a good third party defragger like Diskkeeper’s full product.
Faster disks
The logical solution is to buy faster disks. Go to your existing disk manufactures site and compare their figures with the data you collect for:
PhysicalDisk: Disk Read Byte /sec
PhysicalDisk: Writes /sec
Other Servers
Another cost-nothing solution would be to move the files or database to another server. Alternatively you could use the load-balancing properties of DFS.
Disk Striping
This would be my least favoured option. Technically it is a neat idea, to stripe data across two or more disks. The principle reminds of school days when I had to write out, ‘I must not run across the school grass’ 500 times. To speed up the process I wrote my lines with 3 pens at once. The multiple disk controllers, like my pens, write simultaneously across three disks. The reason I am wary of this method is that there is no redundancy, if any one disk fails you would lose all the data. Of course you could use hardware RAID 5, 10 or 20 which would protect your data against one disk failing.
Diskperf -y and Performance Monitor
Diskperf’s overhead is very small and my advice is to leave it turned on. Another hint that this is the correct approach is that Windows 2003 has diskperf on by default. If you have Windows 2000 and you do not set diskperf -y then you are storing up a problem for when you ever do need to measure disk performance. The problem is that setting diskperf needs a reboot and it would be most inconvenient when you are keen to get on with the troubleshooting.
Perfmon situation 2000 and 2003
DISKPERF [-Y[D|V] | -N[D|V]] [\\computername]
-Y Sets the system to start all disk performance counters when the system is restarted.
-YD Enables the disk performance counters for physical drives. when the system is restarted.
-YV Enables the disk performance counters for logical drives or storage volumes when the system is restarted.
-N Sets the system to disable all disk performance counters when the system is restarted.
-ND Disables the disk performance counters for physical drives.
-NV Disables the disk performance counters for logical drives.
\\computername Is the name of the computer you want to see or set disk performance counter use.
The computer must be a Windows 2000 system.
NOTE: Disk performance counters are permanently enabled on for
systems beyond Windows 2000.
Summary for Disk Monitoring
Be aware that with Windows Server Disk monitoring there are both physical and logical disk counters. Disk activity could mask memory shortage, so always monitor the ‘big 4’ counters, Memory, Processor, Disk and Network.
If you like this page then please share it with your friends
More Help for Detecting Computer Bottlenecks
Download your eBook: The Art and Science of Performance Monitoring for only $5.25
![]() Learn the secrets of which counters to monitor. Master performance monitor logging, develop your skills with structured exercises and examples. Print out a copy to read, while you design logs and alerts to detect network bottlenecks.
Learn the secrets of which counters to monitor. Master performance monitor logging, develop your skills with structured exercises and examples. Print out a copy to read, while you design logs and alerts to detect network bottlenecks.

