Introduction to Exchange 2003 – Disk Performance
When database programs store lots of data, the disk is very likely to be a bottleneck. For the purposes of performance monitoring, Exchange 2003 Server, with its .edb mailstores, comes into the category of a database server. So create a performance log and monitor the disks.
Topics for Disk Performance in Exchange 2003 Server
♠
Exchange 2003 server’s databases
Each mailstore has its own .edb database, for example priv1.edb. Each storage group has its own group of logs, for example E0x.log. Best practice dictates that the logs and databases are on separate disks. It will be interesting to see how the two types of database compare when you analyse their disks with performance monitor.
Monitoring Disk Objects
Disk Queues
I love counters that measure queues. The queue concept is straightforward, the threshold of 2 is easy to remember and above all, queues are good indicators of disk bottlenecks.
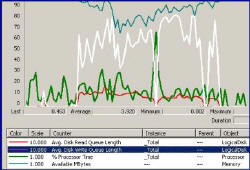
![]() Compare Avg Disk Queue with MSExchangeIS\ RPC Requests
Compare Avg Disk Queue with MSExchangeIS\ RPC Requests
Logical and Physical Counters
It’s possible to log either Physical or Logical disk counters. Whilst I favour Physical counters, you may like to try both and compare readings. My reasoning is that I do not know if you have SCSI, SAN, IDE, RAID5, or RAID 1+0, so cannot predict how your disk combination will affect performance monitoring.
Diskperf
Diskperf and Physical counters. In Windows Server 2003 there is no need to run diskperf -y and reboot. There has been progress from previous versions as the counters are automatically enabled when they are needed. Still, you may like to go to the command prompt and type diskperf.
Read and Write
Most disk counters come in pairs for example, read and write, read queue length and write queue length. You can usually gather extra insights by comparing the data for reads and writes. Also, be aware that ‘transfer’ means reads + writes.
Disk Time
A high value for % disk time, coupled with LOW values for CPU and Network, is a clear indicator of a disk bottleneck. On the other hand, high disk activity but even higher paging could mean that memory is the root cause of the bottleneck. The lesson is always monitoring the ‘big 4’ counters (memory, processor, disk and network).
Multiple disks may mislead
One problem with multiple disks is that performance monitor misleads or even lies. What happens is that the monitor does not always divide the value, by the number of disks. In particular, if you have one busy disk and 3 idle disks, performance monitor reports 100% disk activity, not 25%. Awareness of this foible will remind you to monitor the disks individually. That in turn can provide extra information, for example, whether it’s the disk with the transaction logs that is the busiest or the disk with the operating system.
Guy Recommends : SolarWinds’ Free VM Monitor
The best feature of this new this new version of SolarWinds VM Monitor is that it checks Windows Hyper-V. Naturally, it still works with virtual machines on VMware ESX Servers. VM Monitor is a clever desktop tool that not only tests that your server is online, but also displays the CPU and memory utilization for each node.
It’s easy to install and to configure this virtual machine monitor, all you need the host server’s IP address or hostname and the logon info. Give this virtual machine monitor a try – it’s free.
Download your free copy of SolarWinds VM Monitor.
Specific Disk Counters to Monitor
Performance Counters | Critical Value |
| Object PhysicalDisk | |
| Avg Queue Length (Total) | Less than 2 Requests |
| Avg Disk Read Queue Length Avg Disk Write Queue Length | Less than 2 Requests |
| % Disk Time | Above 60% take note Above 90% severe problem |
| Avg Disk bytes /transfer | Values above 15 KB mean an efficient disk. |
| Avg. Disk sec /Read or Avg. Disk sec /Read | Greater than 0.05 seconds means a bottleneck. |
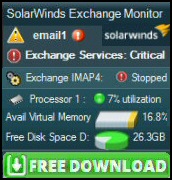
 Guy Recommends: The SolarWinds Exchange Monitor
Here is a free tool to monitor your Exchange Server. Download and install the utility, then inspect your mail queues, monitor the Exchange server’s memory, confirm there is enough disk space and check the CPU utilization.
This is the real deal – there is no catch. SolarWinds provides this fully-functioning freebie, as part of their commitment to supporting the network management community.
Free Download of SolarWinds Exchange Monitor
Free Space – By all means monitor this disk counter, but you are unlikely to see much change in the short term and instead, I urge you to set up Resource Monitoring to check free disk space.
Summary – Disk Monitoring
There are disk counters for both physical and logical disk. Queues are always easy to check and provide clear indications of bottlenecks. When monitoring disks, analysing both read and write counters gives valuable information on what is happening on your Exchange 2003 server.
Download your Exchange 2003 Disaster Recovery and Troubleshooting eBook for only $9.95
 The extra features you get in your eBook include: ‘How to…’ sections with screen shots. Checklists to prepare your migration plan.
Lots of tips, recommendations and troubleshooting advice. Printer friendly pages in both PDF and Word format.

