Windows 7 Resmon (Resource Monitor) 
The Windows 7 Resmon provides a quick and easy way to troubleshoot unresponsive programs and bottlenecks.
Topics for Windows 7 Resmon
- Resmon or Perfmon?
- Creating a Data Collector Set
- The Art of Resource Monitoring
- What You Can Do to Speed-up the Computer
♦
Resmon or Perfmon?
Please humour me. If you are at a Windows 7 or Server 2008 R2 then click on the Start orb, launch ‘resmon’; next launch ‘perfmon’. My point is that in Windows 7 Microsoft has separated Vista’s Performance and Reliability monitor. I also wanted to confirm that you wanted information about the Windows 7 Resource Monitor, and not the Performance Monitor with its Data Collector Sets.
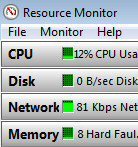
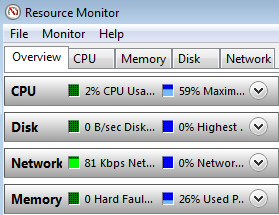
Windows 7 Resmon Tabs and Charts

The resources console contains four main tabs: CPU, Memory, Disk, and Network. There is also an aptly named tab called ‘Overview’. Each of these tabs also displays a chart pane; naturally, you can apply the usual intuitive Windows methods to size and position the charts so as to best display the data.
Filtering Processes:
A new feature of Windows 7 resource monitoring is the ability to analyse the resources consumed by specific processes. From the CPU tab you can see check-boxes next to the ‘Image’, select just those that you are interested in. You should see an orange bar representing the selected images. The advantage of filtering is that the Resource Monitor now displays any Associated Modules or Associated Handles. To remove filtering from all tabs, just right-click and clear the check box next to an Image.
The Art of Resource Monitoring
If your Windows Server 2008 computer is running slower than expected, then you need to find the bottleneck. My advice is to always start with memory, if Free memory is less then 50MB then you have probably found the critical resource. However if you have over 200MB Free or Standby memory then advance to troubleshooting the CPU(s).
If the CPU usage is constantly high, say over 75%, then seek out the Image or process which is hogging the processor(s). Incidentally another new feature of this monitor is that you can right-click an image and ‘End Process’, just as you can in Task manager.
There is not much you can do easily about disk problems, other than to load balance files to another disk. You could of course buy or cannibalise another disk. Beware, what you often find is that what seems like a disk problem, is really shortage of memory. Another possibility is that the disk is about to fail, in which case you should see loads of disk errors in the system event log.
From the network tab you can see precisely what’s taking the bandwidth. Another factor with network problems is that they are likely to affect other machines, thus if connecting to local server or the internet is slower than usual, so check the same task from a different computer.
These are typical sources of bottlenecks, which Resmon can help you troubleshoot.
- Insufficient resources are available. For example, the index service is using most of the memory.
- A program monopolizes a particular resource. For example a virus is tying-up the CPU.
- High disk activity >75%. Check if its reading or writing that’s causing the problem.
- Wireless network, make sure that it’s not automatically downloading videos from the internet.
With Resmon you can also troubleshoot by examining the Process, Resource, Handle or Module associated with the CPU. You can also drill down to the Memory, Disk and Network tabs to investigate which processes are hogging those resources.
Guy Recommends: SolarWinds’ Log & Event Management Tool
LEM will alert you to problems such as when a key application on a particular server is unavailable. It can also detect when services have stopped, or if there is a network latency problem. Perhaps this log and event management tool’s most interesting ability is to take corrective action, for example by restarting services, or isolating the source of a maleware attack.
Yet perhaps the killer reason why people use LEM is for its compliance capability, with a little help from you, it will ensure that your organization complies with industry standards such as CISP or FERPA. LEM is a really smart application that can make correlations between data in different logs, then use its built-in logic to take corrective action, to restart services, or thwart potential security breaches – give LEM a whirl.
Download your FREE trial of SolarWinds Log & Event Management tool.
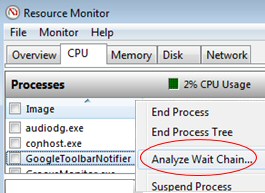
Analyze Wait Chain 

If you right-click on a blocked process, on the context menu you will see "Analyze Wait Chain…". From here you can check the list of threads that are blocking a resource. Further inspection will reveal the owning process. For one-off troubleshooting you can kill the child process.
Meanwhile developers can debug blocked processes with Microsoft’s Wait Chain Traversal APIs
What You Can Do to Speed-up the Computer
- Add more memory. Buy another SIMM / DIMM stick.
- Load-balancing, move some of the files to another disk.

- Research the true bottleneck. Beware low memory masquerading as a disk problem.
- Check the new feature called ‘Analyze Wait Chain’ for unresponsive programs: Click on the CPU Resource Monitor tab. In the Image column, right-click the name of the executable that you want to analyze, and then click: Analyze Wait Chain.
- Try perfmon -report and see if you need to update any drivers. [Perfmon /report if you prefer]
- Run the Windows 7 Upgrade Advisor. I realize this program is designed to run BEFORE you install Windows 7, but it’s unexpectedly useful AFTER you have installed or upgraded.
Nifty Shortcut for Windows 7 Resmon
If you like shortcuts, then you can use perfmon with the resmon switch -res
%windir%\system32\perfmon.exe -res
or
%windir%\system32\perfmon.exe /res
Summary of Resmon in Windows 7 or Windows Server 2008 R2
Firstly, decide which tool is the best for your task, Resmon to display statistics quickly, or perfmon to record data over time. For troubleshooting problems such as unresponsive programs: click on resmon’s CPU tab, then in the Image column, right-click the name of the executable that you want to analyze, and then click: Analyze Wait Chain.
If you like this page then please share it with your friends