Windows 7 Reliability Monitor
As its name suggests, here is where you look to get details about programs not responding, or hardware that’s failing, in fact anything that affects the system’s reliability.
One of the best features of the Reliability Monitor is its ability to keep data for months, thus the graph not only shows trends, but also tracks-back to when a problem started.
Topics for Reliability Monitor
- Finding the Windows 7 Reliability Monitor
- Example of a Reliability Monitor Chart
- Getting the Most from the Reliability Monitor
- How to Reset the Reliability Monitor’s History
♦
Finding the Windows 7 Reliability Monitor
In Windows 7, Microsoft has uncoupled the Reliability Monitor from Perfmon; as a result it took me ages to find its new location in the Control Panel –> Action Center –> Maintenance, View reliability history. See screenshot below.
Alternatively, type ‘Reliability’ in the Windows 7 Search dialog box, then click on ‘View reliability history’.
 Guy Recommends: The Free Config Generator
SolarWinds’ Config Generator is a free tool, which puts you in charge of controlling changes to network routers and other SNMP devices. Boost your network performance by activating network device features you’ve already paid for.
Guy says that for newbies the biggest benefit of this free tool is that it will provide the impetus for you to learn more about configuring the SNMP service with its ‘Traps’ and ‘Communities’. Try Config Generator now – it’s free!
Download your free copy of Config Generator
Example of a Reliability Monitor Chart
The Reliability Monitor shows a timeline of software and hardware changes, application failures, and shutdown problems. The Windows 7 version collects the data using WMI (Windows Management Interface) and this explains why there is no executable such as resmon. WMI also enables you to collect reliability data using Windows PowerShell scripts.
All this makes this monitor more finely tuned compared with its Vista equivalent. Incidentally, if you subscribe to the Customer Experience Improvement Program (CEIP), these are the data events that get sent back to Microsoft.
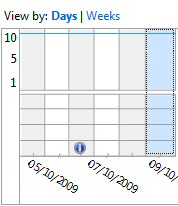
The chart above show three Application failures, which keep the score card (blue line) below the maximum of 10. Note that the five categories which the monitor displays are Application, Windows, Miscellaneous failures, Warnings and Information. Usually the chart defaults to Days, but if | Weeks is highlighted you may wish to click on view by: Days.
Getting the Most from the Windows 7 Reliability Monitor
®


