Windows 8 Reliability Monitor 
As its name suggests, here is where you look to get details about programs not responding, or hardware that’s failing, in fact anything that affects the system’s reliability.
One of the best features of the Reliability Monitor is its ability to keep data for months, thus the graph not only shows trends, but also tracks-back to when a problem started.
Topics for Reliability Monitor
- Find Your Windows 8 Reliability Monitor
- Sample Chart from the Windows 8 Reliability Monitor
- Using the Windows 8 Reliability Monitor
- How to Clear the Reliability Monitor’s History
♦
Find Your Windows 8 Reliability Monitor
In Windows 7 Microsoft uncoupled the Reliability Monitor from the Performance Monitor; consequently the place to check the readings is via the Control Panel –> Action Center –> Maintenance, View reliability history. See screenshot below.
Alternatively, type ‘Reliability’ in the Windows 7 Search dialog box, then click on ‘View reliability history’.
Guy Recommends: A Free Trial of the Network Performance Monitor (NPM) v11.5
v11.5
SolarWinds’ Orion performance monitor will help you discover what’s happening on your network. This utility will also guide you through troubleshooting; the dashboard will indicate whether the root cause is a broken link, faulty equipment or resource overload.
What I like best is the way NPM suggests solutions to network problems. Its also has the ability to monitor the health of individual VMware virtual machines. If you are interested in troubleshooting, and creating network maps, then I recommend that you try NPM now.
Download a free trial of Solarwinds’ Network Performance Monitor
Sample Chart from the Windows 8 Reliability Monitor
The Reliability Monitor will display a timeline of application failures, and shutdown problems. The Windows 8 version collects the data using WMI (Windows Management Interface) and this explains why there is no executable such as resmon. WMI also enables you to collect reliability data using Windows PowerShell scripts. The reliability monitor also collects information about hardware and software updates.
All this makes this monitor more finely tuned compared with its Vista equivalent. Incidentally, if you subscribe to the Customer Experience Improvement Program (CEIP), these are the data events that get sent back to Microsoft.
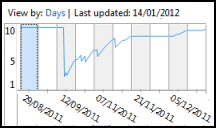
The chart above show just one Windows failures, this is why the blue line drops below the maximum of 10. The display shows five categories of information: Application, Windows, Miscellaneous failures, Warnings and Information. The chart defaults to Days, however it’s easy to switch to Weeks.
Using the Windows 8 Reliability Monitor
®


