Vista – Disk Performance Analysis
Before we begin checking Vista’s disk activity, may I ask you a question: ‘What action are you prepared to take?’ Would you be willing to: buy another disk? Or alternatively, are you merely looking for a cost-nothing solution such as a defrag?
For my part, I just wish to direct you to the best and easiest course of action. My first task is to focus on making a correct diagnosis. My second task is to ask you to check Vista’s WEI rating, I am guessing that for a desktop machine, disk is not the lowest Subscore. Thereafter we examine the tools in Vista’s Reliability and Performance Monitor.
Topics for Vista’s Disk Check
- Diagnosing Disk Performance in Vista
- WEI (Windows Experience Index) – The weakest link
- Reliability and Performance Monitor
- Disk Defragmenter in Vista
- System Diagnostics Report
♦
Diagnosing Disk Performance in Vista
Even though you are investigating disk performance, I would start withMemory! My reasoning is because it is common for disk problems to be masked by memory bottlenecks. Thus you are probably wasting time and money by changing the disk on a machine with only 512Mb of RAM. It would be better to buy another SIMM RAM chip, or at the very least buy a RAM Key and use ReadyBoost.
Classic symptoms of Disk problems
Files take ages to open or to save. The light corresponding to the computer’s hard disk is red for long periods. You may even hear a whirring / clunking sound of disk activity when you save a file. Also, remember to check the System Eventlog, what you are looking for are disk errors, which are advanced warnings that a disk serious failure is immanent.
WEI (Windows Experience Index) – The weakest link
A good diagnosis will save you both effort and money, thus it’s worth spending time finding out what if anything is wrong with your machine’s performance. What I recommend is you improve Vista’s performance by seeking bottlenecks. Begin with a trip to the Control Panel –> System and Maintenance –> Performance Information –> Check your Windows Experience Index. Is your Disk score the limiting factor? Lower than Memory and lower than Processor?
Even old, relatively slow, disks with a speed of 4000 RPM should produce a WEI rating of greater than 3.5, which is an acceptable disk speed for Word-processing and email tasks. Modern disk with a speed of over 7000 RPM are likely to produce a WEI of over 5. Such a high figure means that the disk is not the bottleneck.
Think of your machine’s performance as an oil pipeline. Any constriction will reduce flow, thus removing the tightest constriction will produce the biggest increase in throughput. Indeed Vista’s WEI (Windows Experience Index) works on this principle, the final rating is based on the weakest link and not the average of the 5 readings.
Recommended: Solarwinds’ Permissions Analyzer – Free Active Directory Tool
I like thePermissions Analyzer because it enables me to see WHO has permissions to do WHAT at a glance. When you launch this tool it analyzes a users effective NTFS permissions for a specific file or folder, and takes into account network share access, then displays the results in a nifty desktop dashboard!
Think of all the frustration that this free SolarWinds utility saves when you are troubleshooting authorization problems for user’s access to a resource. Give this permissions monitor a try – it’s free!
Download SolarWinds’ Free Permissions Analyser – Active Directory Tool
Reliability and Performance Monitor
The biggest change from XP’s Perfmon is that Vista’s ‘Reliability and Performance Monitor’ has a summary sheet at its front end. Another key difference is that there are two separate utilities, Performance Monitor (the old perfmon) and the Reliability Monitor. While I love analysing the Performance Monitor, my advice is to stick with the Summary chart. My reasoning is that you should focus on the key questions. Is my machine running slowly because of a disk bottleneck? If so, what can I do about it?
Only resort to the Performance monitor and its zillions of counters if the Summary sheet is inconclusive. Remember that detailed performance monitoring is more productive on a server than a desktop. If a desktop machine only has 512 Mb of RAM what ever the counters say, the answer is always add more RAM. Therefore bite the bullet, order that 72-pin RAM SIMM, and get on with the rest of your life.
Resource Overview (Summary sheet)
Whether you are looking for a performance summary, or the low level detail, begin along this path:
Start Orb![]()
Control Panel –>
System and Maintenance –>
Performance Information –>
Advanced Tools –>
Reliability and Performance Monitor.
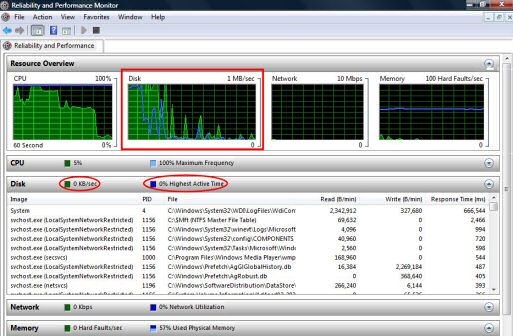
As we are concerned with Disk let us home in on the 2nd bar and the second graph ‘Disk’.
KB / sec and
% Highest Active Time
To see these counters in action, it is best to launch a few applications and then open or save files.
Image –> PID –> File –> Read
The detail under the Disk summary is particularly interesting (see screen shot above). If you open a few applications or files, then you can see how Vista multi-tasks the disk sub-system in real time. What the information shows is which files are being accessed, and whether the operating system is reading or writing from those files.
Guy Recommends: A Free Trial of the Network Performance Monitor (NPM) v11.5
v11.5
SolarWinds’ Orion performance monitor will help you discover what’s happening on your network. This utility will also guide you through troubleshooting; the dashboard will indicate whether the root cause is a broken link, faulty equipment or resource overload.
What I like best is the way NPM suggests solutions to network problems. Its also has the ability to monitor the health of individual VMware virtual machines. If you are interested in troubleshooting, and creating network maps, then I recommend that you try NPM now.
Download a free trial of Solarwinds’ Network Performance Monitor
Performance Monitor (Perfmon)

The Performance Monitor (perfmon) found in other Windows operating systems, has now been moved inside Vista’s Reliability Performance Monitor. It is sufficiently hidden to encourage beginners to look at the summary sheet before tackling the Performance Monitor. I have used Perfmon for years, and still regard it as a black art. Difficulties include, so many counters that the data is confusing and, what do the values mean?
Two useful PhysicalDisk counters
To help you through the maze of counters, this is how I would begin a disk analysis. From the diagram on the right, click on the big green cross, scroll down to PhysicalDisk then expand the selection (double click). I suggest that you add the two counters: % Disk Time and Current Queue Length.
When you analyze the resulting trace the biggest problem is distinguishing spikes of normal activity, from underlying bottlenecks. If % Disk Time is greater than 50% for long periods, then that is a sign of a disk problem. Also any Queue Length greater than 2 is worrying. By all means investigate other disk counters, but I do council you to keep your main goals in mind. Is this a disk problem? If I am sure, what should I do to speed up the machine?
Windows 8 Experience Index (WEI)»
Reliability Monitor
Once you have launched the Reliability and Performance Monitor, seek out the Reliability Monitor in the left hand pane. One point of interest is the System Stability Chart, in particular the index value (also known as the SSI). See 9.22 on the chart below.

Underneath the index part of the chart, are details of any failures. Observe two red xs opposite ‘Miscellaneous Failure in the screen shot above. In fact, tracing this record of failures is more informative than the raw SSI score.
Guy Recommends: SolarWinds Free Network Bandwidth Monitor
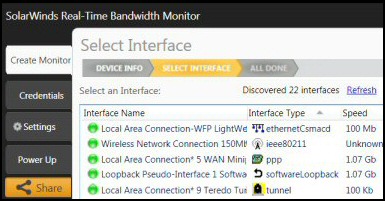
This freeware monitor is great for checking whether your network’s load-balancing is performing as expected, for example, are two interfaces are getting about equal traffic?
It’s easy to install and straightforward to configure. You will soon be running tests to see how much network bandwidth your applications consume.
The GUI has a lovely balance between immediate network traffic data in the middle, combined with buttons to seek related data and configuration settings. Give this monitor a try, it’s free!
Download your free network bandwidth monitor
If you need more comprehensive network analysis software:
Download a free trial of NPM (Network Performance Monitor)
Solutions to Disk Problems in Vista
A defrag would be the place to start. If the machine still runs slowly, consider buying a bigger and faster disk adding more disks would enable you to create a stripe set and thus speed up disk read / write. However, if you have no money, is there any chance that the activity that causes the disk bottleneck could be moved to another machine? For example printing, or scanning. Once a disk gets to about 70% full there would be benefit in weeding out unwanted files, deleting temporary files, and considering storing, backups, or seldom used files to another machine.
Disk Defragmenter in Vista
Start Orb![]()
Control Panel –>
System and Maintenance –>
Performance Information –>
Advanced Tools –>
Open Disk Defragmenter.
Once you open the Disk Defragmenter all that you can do is ‘Defragment Now’, or else schedule a defrag for a more suitable time. In Vista, unlike XP, there is no GUI to analyse your disks and thus see whether they need de-fragmentation. What is more there is no status bar to indicate how a defrag is proceeding. When you read-up on Vista’s defrag it won’t be long before you discover that there are a plethora of third party tools, which provide all the features that you can think of any many that had not realized were available. The only problem is that some cost more than Vista.
With defrag you go through stages, of: 1) This file moving is amazing. 2) I dare not do anything during a defrag (perfectly safe). 3) There is nothing to this defrag. My final thought on this sequence is not to be lulled into a false sense of security. If you do buy a defragger, make sure that it is certified for Vista.
Defrag.exe in Vista
If you launch a cmd prompt, preferably with ‘Run as administrator’, then you can issue the following command:
defrag /?
Here is the resulting information on defragging your machine. As you will see, the command line executable gives much more control than the GUI version.
Syntax: defrag <volume> -a [-v]
defrag <volume> [{-r | -w}] [-f] [-v]
defrag -c [{-r | -w}] [-f] [-v]
Parameters:
Value Description
<volume> Specifies the drive letter or mount point path of the volume to
be defragmented or analyzed.
-c Defragments all volumes on this computer.
-a Performs fragmentation analysis only.
-r Performs partial defragmentation (default). Attempts to consolidate fragments only smaller than 64 megabytes (MB).
-w Performs full defragmentation. Attempts to consolidate all file
fragments, regardless of their size.
-f Forces defragmentation of the volume when free space is low.
-v Specifies verbose mode. The analysis output is more detailed.
Examples:
defrag d:
defrag d:\vol\mountpoint -w -f
defrag d: -a -v
defrag -c -v
System Diagnostics Report
Start Orb![]()
Control Panel –>
System and Maintenance –>
Performance Information –>
Advanced Tools –>
Generate a system health report
In particular, look out for these two tests:
SMART Predict Failure Check
Logical Disk Dirty Bit
If you like this page then please share it with your friends
Configuring Windows Vista Topics:
| Vista Tools and Extras
|
Download Your Tweak the Registry Ebook for only $6.45 This ebook will explain the workings of the registry. I thoroughly enjoy tweaking the registry, and I want to distill the best of my experiences and pass them on to you. Each registry tweak has two aims; to solve a specific problem, and to provide general learning points, which help you to master regedit. Over 60 pages ebook and PDF format
| |
