System monitoring platforms monitor all facets of your network infrastructure from servers right down to devices. Monitoring systems throughout your network give you the perspective to accurately view the performance of your network. With a system monitoring tool you can view the utilization, CPU usage and latency of key elements in your network. This is important because it allows you to address problems in their infancy before they become worse over time.
Almost every Windows user has encountered a system monitoring tool called Task Manager. Task Manager was designed as a small utility to help you monitor your resources. Though the program’s abilities are commendable they pale in comparison to the near-omniscient perspective offered by most modern system monitors with dedicated alerts and notifications. In this article, we’re going to look at the best system monitoring tools available.
Here is our list of the best system monitoring tools:
- SolarWinds Server and Application Monitor (FREE TRIAL)
- Paessler PRTG (FREE TRIAL)
- ManageEngine OpManager
- Zabbix
- Spiceworks Network Monitor
- Ipswitch WhatsUp Gold
- Nagios XI and Nagios Core
1. SolarWinds Server and Application Monitor (FREE TRIAL)

First up we have SolarWinds Server and Application Monitor. For a long time, SolarWinds has been at the forefront of the market when it comes to managing IT infrastructure. The user interface is not only very modern and fast-paced, but allows you to see the health of your infrastructure from a glance. Whether this is legacy infrastructure or applications tied into remote locations and cloud services, SolarWinds Server and Application Monitor has you covered.
Deployment is an area that SolarWinds Server and Application Monitor performs exceptionally well. The time from setup to live monitoring will take about an hour. Once you’ve finished the initial setup you can enjoy the use of over 1200 application monitoring templates. This includes services like Active Directory, Office 365 and IBM WebSphere. These performance monitoring templates eliminate the need to manually configure everything once you deploy SolarWinds Server and Application Monitor.
However, if you want to create your own monitoring environment with your own templates then you can do this as well. You can create custom monitors from scratch or import scripts from elsewhere. SolarWinds Server and Application Monitor has a Component Monitor Wizard which allows you to choose between a variety of component monitors. For example, the process monitor uses SNMP to assess the physical memory of a device alongside its CPU usage. This makes it much easier to structure your monitoring environment as you wish.
In terms of resource monitoring, SolarWinds Server and Application Monitor is excellent. On the AppStack dashboard you can view a breakdown of your total network infrastructure broken down into sections and categorized as Up, Warning, Critical and Down. All of these warnings are color-coded so that you can tell in a matter of seconds if there is a problem. The layout is simple enough that you’re able to act promptly when a problem emerges.
Overall SolarWinds Server and Application Monitor is a first-class infrastructure monitoring tool. It provides you with everything you need to know to ensure that your service is up and running. If a resource is close to reaching capacity, you’re going to know about it. SolarWinds Server and Application Monitor starts from a price of $2,995 (£2,261). You can also download a 30-day free trial from this link here.
2. Paessler PRTG (FREE TRIAL)
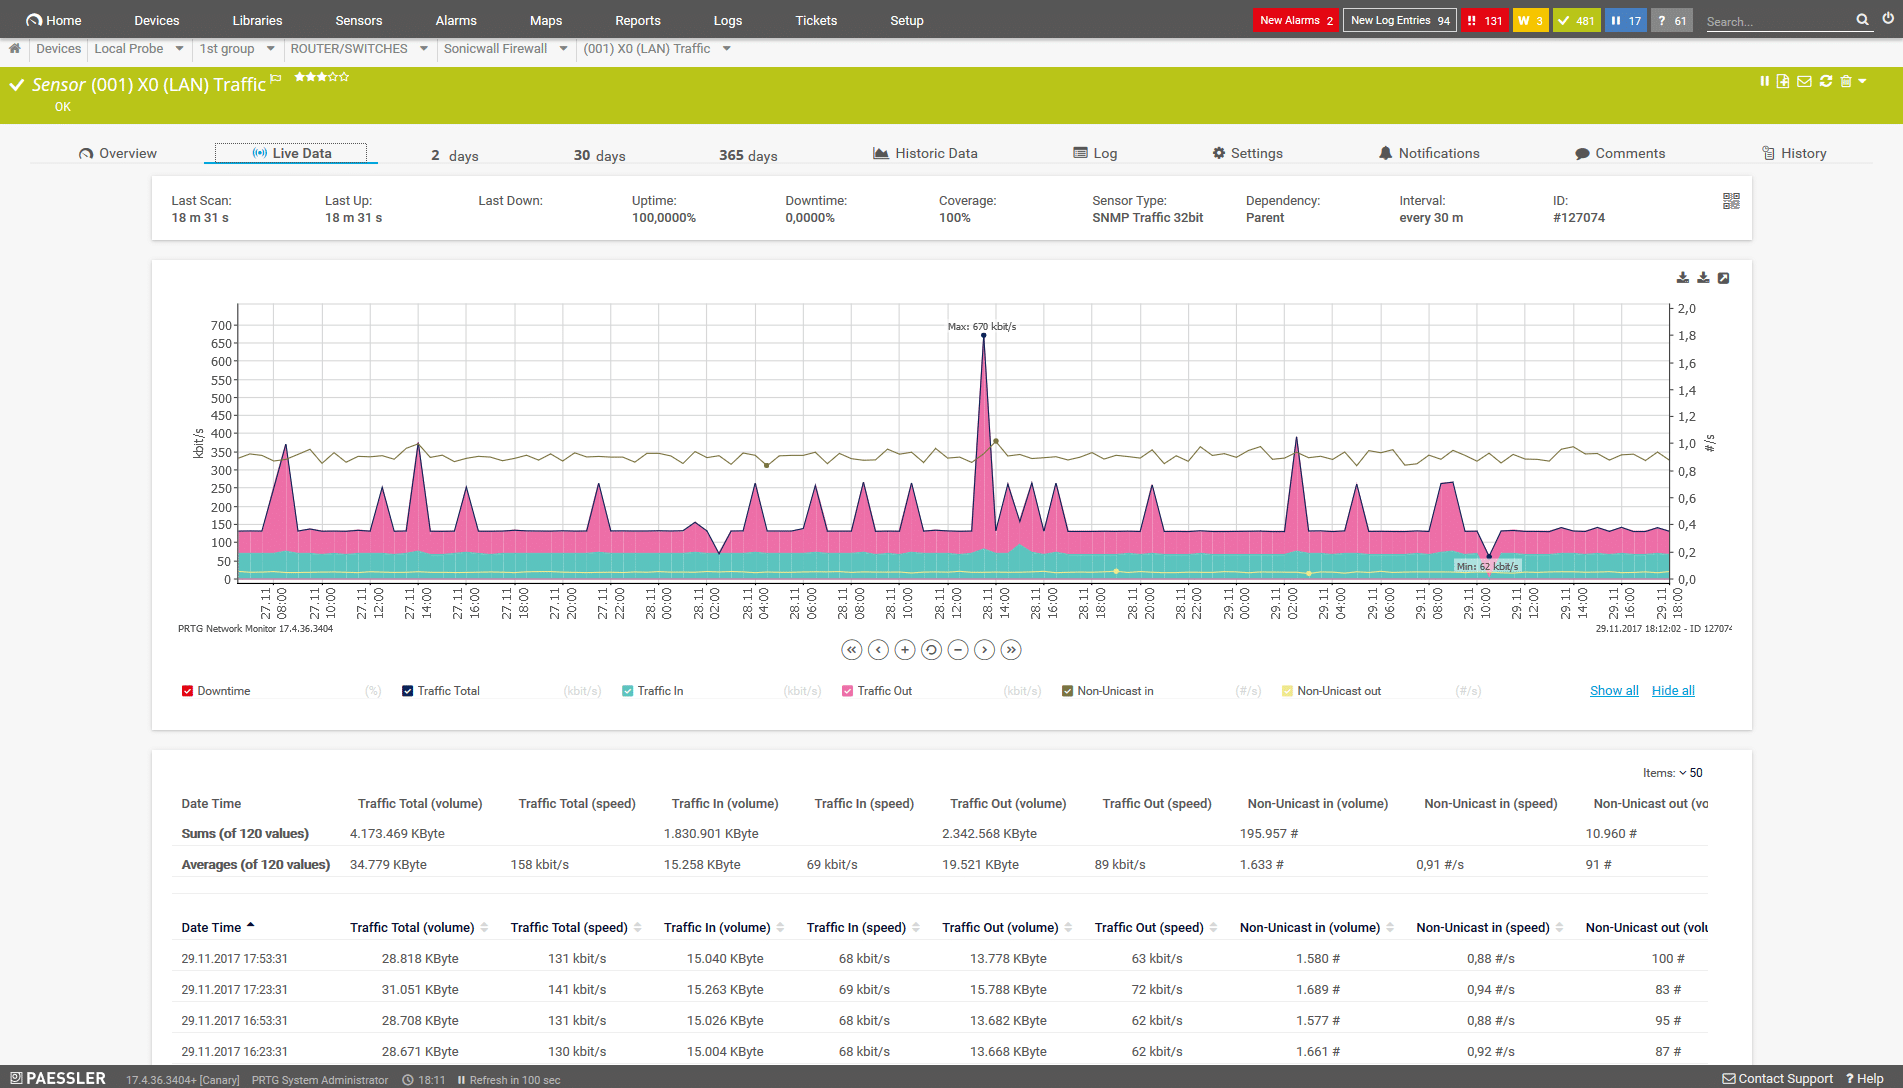
Paessler’s PRTG is another excellent network monitoring tool. With PRTG you can monitor everything from network devices to servers and applications. PRTG has a variety of protocols at its disposal including SNMP, WMI, NetFlow, IPFIX, jFlow and sFlow. This provides you with everything you need to monitor your LAN environment effectively.
PRTG has its own autodiscovery feature that allows you to scan network segments by IP ranges. This reduces the amount of time it takes to prepare for live monitoring. It also makes it easy to rescan your network in the future if you need to add new devices and upscale your network infrastructure.
One of the best aspects of PRTG is its alerts system. PRTG sends you email or SMS alerts when it registers problematic activity. You can also receive push notifications straight to your phone if you download the PRTG apps for Windows, iOS and Android. This keeps you within reach of your network even when you’re not at your desk.
PRTG does its pricing options based on the amount of sensors you require. PRTG is available for free with less than 100 sensors. The first paid product is 500 sensors for $1600 (£1,208). Larger organizations can purchase 1000 for $2850 (£2,152), 2500 for $5950 (£4,493) and 5000 for $10500 (£7,930). Even larger organizations can purchase the XL1 version with unlimited sensors for $14500 (£10,951). For a full-list of pricing options and a 30-day free trial of PRTG you can click on this link here.
3. ManageEngine OpManager

ManageEngine OpManager is one of the most dominant system monitoring tools on the market right now. When loading up the program it is easy to see why. The production value of the user interface and the contemporary display provides the user with a crystal clear monitoring experience. Each dial, graph and box can be read in a matter of seconds.Applications are color-coded based on their health, and categorized as Clear, Critical, Trouble, Attention, Unknown or Service Down.
The installation process is also very straightforward. Once you’ve completed the initial setup ManageEngine OpManager will start to autodiscover devices. Autodiscovery means that you can start monitoring without having to go through an exhaustive process of configuring every device on your network. This is particularly beneficial for administrators working within larger networks (ManageEngine OpManager can automatically discover up to 15,000 interfaces).
Another area that ManageEngine OpManager performs well is with alerts. The platform allows you to configure thresholds for devices based on metrics relating to CPU, memory usage, memory utilization, and availability. Once the system recognizes that a device has exceeded a threshold then you will be sent an alert. Alerts help you to take a step back from the monitoring process and still keep up with what is going on.
You also have the ability to generate reports on your network activity. ManageEngine OpManager comes with over 100 built-in reports so that you can take a closer look at the rising trends on your network. This is useful for anticipating when you need to upscale your infrastructure and for implementing capacity planning. Sometimes looking at a report gives you more time to pay attention to the finer details and consider what is going on.
ManageEngine OpManager is a product that we recommend for organizations looking for a solution that is easy to deploy on Windows and Linux. The fast installation and autodiscovery minimize any disruption faced by deploying this product. The Essential Version of ManageEngine OpManager can be purchased for $595 (£449). There is also a free version that allows you to monitor up to 10 devices. You can download the free version of ManageEngine OpManager from this link here.
4. Zabbix

Next up on our list we have the open source system monitoring tool Zabbix. Zabbix is a free tool that has been designed with larger organizations in mind and has no single point of failure. It also uses authentication and encryption to make sure that your data stays protected from malicious entities. Its network monitoring can be used to view network performance, health and configuration changes. It also has support for SNMP, IPMI and IPv6.
Zabbix has its own autodiscovery facility which discovers when new devices are connected and adds them to your monitoring environment. This autodiscovery facility is great because it can also detect device configuration changes or if firmware is upgraded then Zabbix is able to tell. This makes for a satisfying monitoring experience because the program automatically keeps up with real-time changes on your network.
With Zabbix you can monitor your network performance by monitoring your network bandwidth usage and looking out for excessive CPU or memory usage. This is more than enough to start monitoring your environment effectively. You can also view the health of your infrastructure from systems availability to its temperature and disk space. It even has its own alerts system to keep you up-to-date.
With regards to configuration, Zabbix eliminates lots of hassle by offering a variety of out of the box templates for common infrastructure providers. Zabbix has templates for Cisco, Dell, Intel, Netgear, MikroTik, Huawei, and QTech networks. Each of these templates includes unique triggers, graphs, and discovery rules for the relevant service. This allows you to adopt a specialized approach to your network monitoring without having to research lots of information with third parties and configuring on a case-by-case basis (though you can still do this if you wish).
Zabbix is a tool that is suitable for organizations of all sizes. This open source tool provides one of the best monitoring experiences you’ll find on the market. Zabbix can be downloaded on CentOs, Debian, Oracle Linux, Red Hat Enterprise Linux, and Ubuntu. If you’d like to download Zabbix then you can do so through this link here.
5. Spiceworks Network Monitor

Spiceworks Network Monitor is a solution that has been designed specifically for smaller organizations. One way this is visible is the setup process. The installation process is simple so that you can start adding devices to monitor promptly. Spiceworks Network Monitor uses SNMP polling to verify the status of devices throughout your network and to make sure that everything is operational.
The user interface is relatively basic, but it allows you to see what’s going on clearly. You can view the CPU, disk and memory utilization of your devices to get an appraisal of their overall health. There is also an alerts system to keep you up-to-date on current developments on your network. These notifications are customizable so that you can determine what you see once a warning has been raised. Unfortunately, you don’t have the ability to configure your own alert parameters. While this isn’t the end of the world it is noticeably absent from this program.
This program is aimed towards smaller organizations so we advise medium or large organizations to look for another product. The reason is that it simply doesn’t have the bandwidth to accommodate the needs of larger networks. Spiceworks Network Monitor is available for free for companies monitoring less than 25 devices. It is important to note that Spiceworks Network Monitor is set to be replaced by a cloud-based tool in the future. However if you want to download SpiceWorks Network Monitor then you can do so through this link here.
6. Ipswitch WhatsUp Gold

WhatsUp Gold is another key player in the system monitoring industry. WhatsUp Gold has developed a popular following because of its back to basics approach to network monitoring. The first thing you notice about the home dashboard is how neat and uncluttered it is. On the dashboard you can flick between the overview, top 10, actions & alerts, wireless, cloud, storage, core network and wireless network views. You can also create custom dashboards for individual users on your team. This is particularly useful for larger networks that are managed by multiple people.
Manual configuration isn’t a problem with WhatsUp Gold as this tool automatically discovers devices throughout your network. This is advantageous because it allows you to start monitoring without going through the process of configuring network devices. Once you’ve completed autodiscovery you can then view your network as a topology map. This is great for seeing how your devices actually connect together. Clicking on a device in this view allows you to take a closer look at its overall health.
Alerts are a feature that WhatsUp Gold delivers as a solid experience. There are out of the box configurations for alerts but these can be customized based on your needs. Once a problem has been flagged you are sent a message via email, SMS, or Slack. You can view your alerts at any time through the alert center dashboard. This provides you with a location where you can meet emerging problems head on and clear your workload.
In the event that you need to run further analysis then you can generate a report. You can filter your network data to generate custom reports to take a microscope to certain aspects of your network. Once you’ve completed a report you can export it in a number of different formats. This means that it is easy to send your data to other members of your team and to pass on to third-party applications needed.
There are a number of versions of WhatsUp Gold available to download. In order to view definitive prices for WhatsUp Gold you’ll need to contact the sales team. However if features like network traffic analysis, application monitoring, virtualization monitoring and configuration management are important to you then we recommend you purchase the Total Plus license. You can also download a trial from this link here.
7. Nagios XI and Nagios Core

Finally we have Nagios XI and Nagios Core. These two products are some of the most popular network monitoring tools available today. While they don’t offer the same crisp user interface as a product like WhatsUp Gold or ManageEngine OpManager, they have a design that is good enough to conduct some solid infrastructure monitoring. Both products are very simple to set up but Nagios XI in particular has an extensive array of configuration wizards.
Configuration wizards take you through the process of configuring various aspects of your network. There are wizards for autodiscovery, DHCP, DNS Query, Email Delivery and Linux Servers to name a few. These wizards help newer users to come to grips with how to use the program and eliminate the need for guesswork. While editing Nagios XI’s configuration files can be a little more complex, these wizards step you through much of the day-to-day processes you’ll encounter.
Nagios XI offers an extensive array of graphs and charts to help you look for active trends in your network infrastructure. One particularly useful graph is the capacity planning graph. This helps you to anticipate when your network infrastructure won’t be able to sustain day-to-day operations. As a result you can take action and upscale your infrastructure before your demand outpaces your infrastructures supply.
Nagios Core is essentially a more rudimentary version of Nagios XI. With Nagios Core you can still make use of auto-discovery and graphs although the experience isn’t as slick as Nagios XI. It is important to note that you can use plugins with Nagios Core to expand its functionality. There is an entire site of Nagios plugins that can be used by both products.
Overall Nagios XI and Nagios Core are solid products. Between the two we recommend Nagios XI as even though it isn’t free, it offers a higher quality monitoring experience. The Standard Edition of Nagios XI Starts from $1,995 (£1,476). However, if you want to use features like scheduled reports and capacity planning reports then you will need to purchase the Enterprise Edition for $3,495 (£2,639) and up. You can also download a free trial from this link here.
System Monitoring Tools: A Failsafe
That concludes our list of the best system monitoring tools available right now. Based on a variety of factors we find SolarWinds Server and Application Monitor to be the best overall product on this list. The dashboard delivers the perfect balancing act between depth and simplicity. Whereas other dashboards can overwhelm you with information SolarWinds Server and Application Monitor’s design is simple enough that you can monitor without scrolling through a variety of windows.
The most important thing to remember about system monitoring is to be proactive. Being proactive and staying vigilant against potential problems is the best way to keep your services well-maintained over the long-term. Ultimately while it is impossible to know when a key service will fall victim to down time, there are many indicators that you can pick up on before anything happens.