Wireshark is one of the most commonly-used deep packet inspection tools in the world. This small program has become one of the core tools used by network administrators the world over. The reason it has become so widely-used is because deep packet inspection tells you a lot of information about the nature of your network traffic. Wireshark works by pulling packets from your network traffic and displaying them in a format that you can understand.
This format is referred to as human readable, and tells you the nature of a device or applications network usage. It can help to indicate devices that are malfunctioning or using too much data. In short it offers you a way to troubleshoot your network for flaws and to make sure that an unauthorized user or program isn’t active on your network. In this article we’re going to outline how you can use Wireshark to capture and inspect packets.
Downloading Wireshark
Before looking at how you can use Wireshark to capture and inspect packets you first need to download it. Wireshark can be downloaded for free from the official website. You can download Wireshark for Windows and Mac OS. For Linux and Ubuntu machines, you can install Wireshark from the source. For instance on Ubuntu you can download Wireshark by entering the following command:
$ wget https://1.as.dl.wireshark.org/src/wireshark-2.6.1.tar.xz
You can then extract it by entering this command:
$ tar -xf wireshark-2.4.2.tar.xz -C /tmp
How to Capture Packets
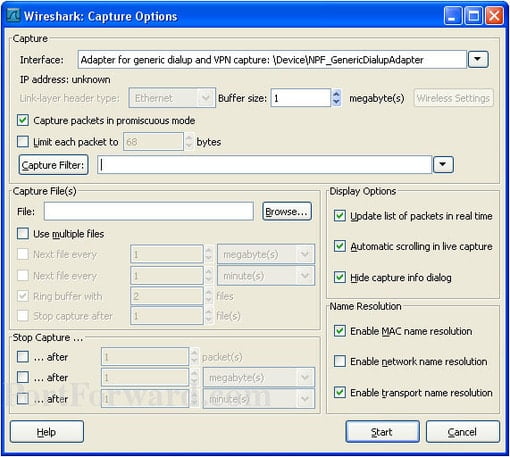
Capturing packets is the bread and butter of using Wireshark. Capturing packets will be the backbone of your network monitoring activity through Wireshark. Once you’ve completed the installation of Wireshark you need to select a network interface to capture from. To do this, click on Capture > Options and select the interface you want to monitor. Alternatively, you can do this by double-clicking on a network interface in the main window.
If you know which interface you want to capture data from you can start capturing packets by entering the following command:
$ wireshark -i eth0 -k
It is important to note that you can capture data from multiple networks simultaneously if you want to (this can be achieved by pressing Shift or Ctrl and manually selecting the networks you want to pull data from). Once you’ve selected what interface you want to monitor, select Start from the Capture menu or Ctrl + E.
After this has been completed the packet capturing process will begin. When you’re ready to stop you can click on the Stop button (red button) or press Ctrl + E.
At this stage it is worth verifying that you have Promiscuous Mode enabled to make sure that you can see all of the necessary network packets. You can do this by clicking on Capture > Options and making sure that “Enable promiscuous mode on all interfaces” has been checked.
Inspecting Packets in Wireshark
Once you’ve completed the above steps you’re ready to start inspecting packets in Wireshark. There are three main panes for you to start inspecting packets:
- Packet List
- Packet Details
- Packet Bytes
Packet List
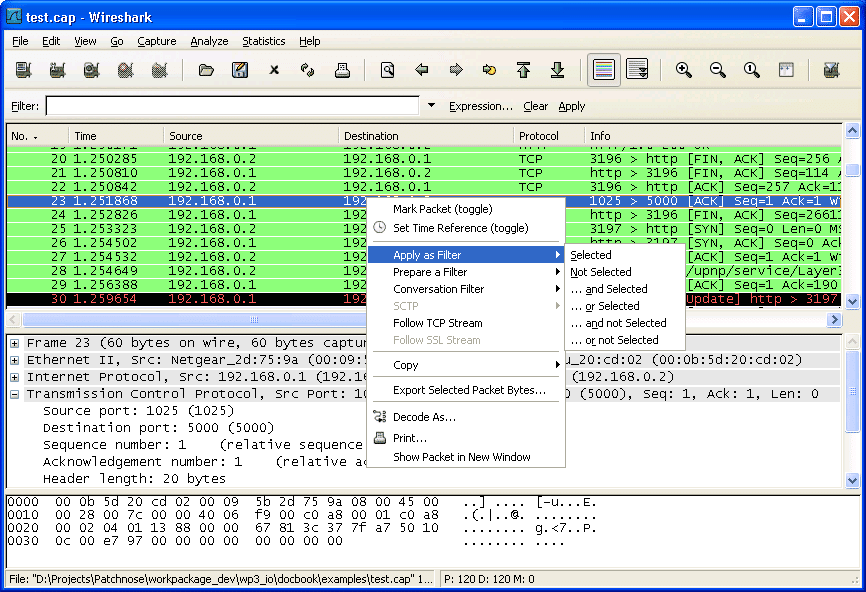
The Packet List pane is the main part of the screen in the GUI; it shows a table of packets broken down into the following values: No., Time, Source, Destination, Protocol, Length, and Info.
- Time – Shows you when the packet was captured. The number is the amount of seconds between the current time and when the file was created (this can be modified by clicking on the View menu and selecting Time Display Format to display the actual time).
- Source – Here you can see where the packet came from (this is generally shown as an IP address).
- Destination – The destination is the end location that the packet is being sent to.
- Protocol – This section shows you the name of the protocol being used, for example, TCP or HTTP.
- Length – The size of the packet is shown here in bytes.
- Info – Contains additional information about the packets content.
In the Packet List pane packets are broken down into different colors. These colors are used to denote the type of traffic that’s traveling across your network. For example, black shows packets with errors and light purple is used to highlight TCP traffic. A full list of color rules can be seen by clicking on View > Coloring Rules. These can be customized if needed. This is discussed in further detail below.
Packet Details
The Packet Details pane is located underneath the Packet List pane and shows information on the protocols of the chosen packet. In this pane you can add filters by right-clicking on the packet you wish to examine closer.
Packet Bytes
Finally we have the Packet Bytes pane which is located at the bottom of the screen and displays the internal data that a packet is carrying. The Packet Bytes pane shows packets in hexadecimal format with 16 hexadecimal bytes and ASCII bytes. You can change the format from hexadecimal to another option by right-clicking and choosing your preferred option.
Wireshark Color Codes
As mentioned above, Wireshark uses color codes to denote packets and help the user to differentiate at a glance. All colors are either temporary or permanent rules. A temporary rule stays active until the program is closed and a permanent rule is available when you use Wireshark the next time. You can set a temporary rule by pressing the Ctrl key and a number simultaneously.
If you want to permanently colorize packets in Wireshark go to View > Coloring Rules. This will open the Coloring Rules window. To add a new rule you need to press the + button on the screen to add a new rule. You can then pick the color of your selected packet.
Filtering: Essential for Inspecting
Filtering is the secret for inspecting your packets effectively. Everyday a network has tons of packet transfers occurring and attempting to monitor them all at once isn’t very useful. The reason is that this generates a volume of data that is too large to navigate through effectively (particularly in real-time!). As a result, administrators commonly rely on filtering to get the job done.
There are many different ways you can use filters to inspect traffic but the simplest way is to type your filter into the Search box. For example if you type “TCP” then Wireshark will only show you TCP packets for you to monitor. This helps to eliminate less useful information and create a target approach to your monitoring. You can also filter by using Wireshark’s default filters. You can do this by clicking Analyze > Display Filters.
There are over 227000 fields in 3000 protocols. A full display filter reference can be found on the Wireshark website. One of the most common ways to filter traffic is by value. You can use syntax to dictate what results you see. For example you can input a comparison operator with the following command options:
- eq, == Equal
- ne, != Not Equal
- gt, > Greater Than
- lt, < Less Than
- ge, >= Greater than or Equal to
- le, <= Less than or Equal to
The Most Common Display Filters
There are many different display filters that you can use but we have come up with a core list of the most important filters you need to know how to use:
- ip.addr == 10.0.0.1 – Filters for any packet that has 10.0.0.1 as a source or destination.
- p.addr== 10.0.0.1 && ip.addr ==10.0.0.2 – This sets a conversation filter between two IP addresses.
- http or dns – Displays all http or dns data.
- cp.port == 4000 – Filters any TCP packet with 4000 as a source or destination.
- tcp.flags.rest ==1 – Displays all TCP resets across your network.
- http.request – Used to show HTTP GET requests.
- tcp contains traffic – Shows all TCP packets that contain the word ‘traffic’.
- !(arp or icmp or dns) – Setting to ignore protocols like arp, dns and ICMP which may obscure more important traffic.
- tcp.analysis.retransmission – A setting used to display all retransmissions.
Wireshark: Essential Network Monitoring
Wireshark is an extremely versatile tool and there are so many different ways you can use it to inspect and filter packets. This guide will serve you well on the basics, but the more time you actually spend inspecting packets and creating custom filters will increase your ability to tell what is going on.
While deep packet inspection sounds like a complicated piece of jargon it doesn’t have to be. Wireshark’s GUI is easy to use and you can execute lots of your analysis through the use of the menus before diving into the more complex information in the panes. There are many different display filters to get used to on Wireshark. We have included a list of the most important ones so that you can hit the ground running asap.
That concludes our guide to capturing and inspecting packets with Wireshark.