Review of the Windows 2008 Network Monitor (Netmon.exe)
The Microsoft Network Monitor v3.2 is a tool which captures TCP/IP packets and reveals their source and destination addresses along with detailed information stored in the datagram header. All that is required to collect and display data is a computer with a network card, you don’t need a router as you do with proprietary NetFlow traffic analyzers.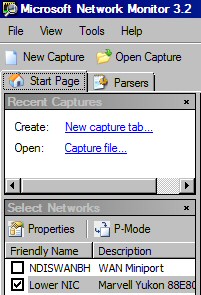
Topics for Windows 2008 Network Monitor 3.2
- Intro to Microsoft Network Monitor 3.2
- Typical Tasks for Microsoft Network Monitor
- What’s new in Network Monitor 3.2
- Using Capture Filters
- Enable Network Conversations
- 7 Tips for Windows Network Monitor
- NetFlow Traffic Analyzer
Introduction to Microsoft Network Monitor 3.2
Reports of Windows Network Monitor’s demise have been exaggerated. Version 3.2 is thriving; furthermore Netmon is ready to capture network frames on a Windows Server 2008 computer.
What has caused the confusion is that in Windows Server 2008 you cannot add the Network Monitor as a ‘Feature’; instead you must download the utility from Microsoft’s site, and then install it from the Win32 Cabinet Self-Extractor. In the old days with Windows 2000/3 you could install version 1, or 2 from the Add/Remove Programs, Windows Components.
Network Monitor 3.2 not only works on all modern Windows operating systems, such as Server 2008, Vista, Windows Server 2003 and XP, but it is also is supported by Microsoft.
Typical Tasks for Microsoft Network Monitor
Whilst it is easy to understanding the twin principles of capturing network traffic and displaying information, getting this tool to work can be frustrating for a beginner. It reminds me of learning to windsurf, at first it seems impossible that I could stand up on that board, never mind manoeuvre the sails.
Most of the problems learning to use Network Monitor stem from being swamped by the volume of data that this utility collects. The best way to start your voyage is to focus on the filters. What really helps is if you have a clear purpose for each journey with Netmon, that way you don’t get side-tracked by irrelevant menus. Moreover, each successive journey will be easier because you can navigate by familiar landmarks.
Troubleshooting connectivity problems.
Let us imagine that DNS is not working. If you capture the appropriate frames with the Network Monitor, you may discover from the destination address that your machine is trying to connect to a non-existent DNS server.
Calculating server response times.
Each packet has date / time information, thus you can measure response times for conversations between your computer and various servers. If necessary you could instigate a conversation with ping.
TCP re-transmissions. 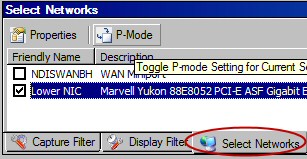
A significant number of re-transmissions could indicate an intermittent connection problem.
Identify broadcast traffic.
Broadcast traffic is an old enemy of network managers. You could use seeking broadcast or multicast traffic as an opportunity learn more about Network Monitor, while you check for a well-known network problem.
Your first task is to find, and then research the P-Mode button. The ‘P’ stands for promiscuous capture.
Guy Recommends: A Free Trial of the Network Performance Monitor (NPM) v12
v12
SolarWinds’ Network Performance Monitor will help you discover what’s happening on your network. This utility will also guide you through troubleshooting; the dashboard will indicate whether the root cause is a broken link, faulty equipment or resource overload.
Perhaps the NPM’s best feature is the way it suggests solutions to network problems. Its second best feature is the ability to monitor the health of individual VMware virtual machines. If you are interested in troubleshooting, and creating network maps, then I recommend that you give this Network Performance Monitor a try.
Download your free trial of SolarWinds Network Performance Monitor.
Network Monitor History
Version 3.2 is the latest version of Network Monitor for use with Windows Server 2008. Previous versions, namely 2.0, 1.1, and 1.2, were for Windows Server 2003 and 2000.
What’s new in Network Monitor 3.2
- Find Network Conversations: This new feature works by segregating related frames.
- Process tracking: Check for rogue processes. Learn about ‘good’ processes. It works by categorizing packets based on the ID of the process.
- Better GUI for the Server 2008 monitor. Easier to drag and resize the various windows.
- Support for parser upgrades.
Tip: Check the version number in Control Panel. Go to Programs and Features, right-click on the Columns, choose ‘More’ and add the ‘Version’ tab. Scroll down to Microsoft Network Monitor: Parsers.
The Capture
To capture frame data, you must install both the Network Monitor and its driver on the local computer. The Network Monitor driver (also called the Network Monitor agent) enables the Netmon executable to receive and display frames from a NIC (network interface card).
Once netmon.exe has captured the packets from the network card, its parsers can convert raw data into information that you can analyze in the GUI. As a result you (or anyone else) can read the rich seam of information carried within the packets, including unencrypted passwords and other sensitive information.
Using Capture Filters
The efficiency of Network Monitor’s collection coupled with the parsers’ detailed analysis results in an embarrassment of riches. The key to getting the most from Network Monitor is to master the filters. Actually, the capture and display filters use the same syntax.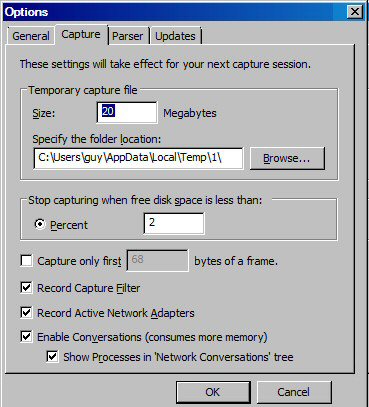
Before you start proper work, it’s a good idea to set the Server 2008 monitor ‘Options’.
Tools Menu –> Options –> Capture
- Temporary capture file (Buffer Size)
- Folder Location
- Capture only first x bytes of a frame – useful if you want to conserver buffer space and you are only interested in the frame’s header.
As fast as the driver or agent receives network packets so they are stored temporarily in a capture buffer.
Next the Network Monitor 3.2 compares the frames in the buffer with the capture filter. All the frames that match the capture filter are displayed in the GUI. Frames which don’t match are discarded.
Begin with Standard Filters
Begin by clicking on the Filter menu, Capture (or Display) Filter –> Load Filter – Standard Filters. Now make your selection, for instance HttpWebpageSearch.
You will soon get the idea of how the filter works, but does take a while to achieve just the results that you want. Just ‘playing’ can result in confusion, what helps is a clear goal, for example you just want to capture http traffic.
Master typing in the Filter dialog box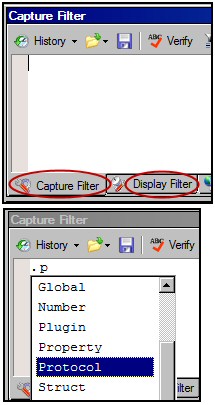
Once you have used some of the Standard Filters, the learning progression involves selecting data by harnessing the IntelliSense of the Capture (or Display) Filter box. Begin by typing a period (.) also called the full stop. Now you should see the top level names. Type ‘p’ and IntelliSense kicks in again and displays Protocol.
You could repeat the method and thus append HTTP. The result should look like: .Protocol.HTTP.
Alternative Filter Method
Another way of creating filters is to reverse engineer a frame capture. Start with the Frame Summary screen, then right-click an interesting entry. Next select: ‘Add Source to Display Filter’ from the drop-down menu. The knack is to select the ‘Source’ column for your click, rather than the ‘Time Offset’.
Save Your Captures
You can save a capture file by clicking Save As on the toolbar. A good option when you save is to select only those frames which match your filter criteria. Naturally you can load previous captured files by using the Open Capture dialog box.
Copy Frames
At first the idea of copying frames did not seem to offer much benefit. But then I realized that you could copy a bunch of frames into Excel and then unleash the spreadsheet’s maths on the numeric fields. For example, calculating average response times.
On another occasion I pasted the data into an email and thus made the point forcibly to the party who was hogging the network.
Quick Capture Statistics
During a capture, Network Monitor 3.2 displays statistics in the status bar at the bottom of the window:
- Displayed: The number of displayed frames in the Frame Summary window.
- Dropped: The number of dropped frames.
- Captured: The total number of frames captured for the active tab.
![]()
Guy Recommends: SolarWinds Network Topology Mapper (NTM)
NTM will produce a neat diagram of your network topology. But that’s just the start;Network Topology Mapper can create an inventory of the hardware and software of your machines and network devices. Other neat features include dynamic update for when you add new devices to your network. I also love the ability to export the diagrams to Microsoft Visio.
Finally, Guy bets that if you test drive the Network Topology Mapper then you will find a device on your network that you had forgotten about, or someone else installed without you realizing!
Download your 14 day free trial ofSolarWinds Network Topology Mapper
Enable Network Conversations
Isolating conversations is a useful technique for grouping captures, and seeing more clearly what is occurring. Displaying Network Conversations in a new feature of Netmon v 3.2, and the key point is to select the conversation from the tree on the left of the Network Monitor GUI.
You can take this troubleshooting technique one stage further by selecting ‘Show Processes’ (see Options screenshot above).
Using this technique you could research unknown processes; one day you may discover a rogue program that has infiltrated your network.
Network Monitoring with Virtual Machines and Windows Server 2008’s Hyper-V
In a nutshell, network monitoring between Windows Server 2008 Virtual Machines is difficult. A Network Monitor on the Server 2008 host computer cannot see traffic between VMs because this traffic never reaches the capturing agent or driver on the host. The only traffic you can see on the host is traffic from the VMs to an external computer. Remember that the Network Monitor on a VM can capture only traffic directed to or from that VM.
Advanced Topic – How Network Monitor Parses
All network traffic monitors rely on two processes, firstly, capturing your network’s packets, frames or datagrams (call them what you like). Secondly, a parsing engine which makes sense of the raw bits, bytes or data (call it what you like).
Once you have mastered the basics of capturing and filtering the network traffic, you may wish to investigate a whole new world of parsers. On the one hand parsers teach you how packet collection works ‘under the covers’, on the other hand, parsers are the gateway to a new level of controlling the way raw data is displayed in the monitor. See here for SolarWinds Network Traffic Analyzer.
Getting Started
Click the ‘Parsers’ tab next to the Start Page.
Begin with an overview of all the available parsers. As you gain in confidence and experience, you could try modifying and saving the new Parsers. However, to my mind being an expert at creating parsers is a different and higher level skill from troubleshooting data.
The built-in parsers are written in the Network Parsing Language (NPL), this is means that there is a whole industry who use a common standard when developing parsers.
7 Tips for Windows Network Monitor
- Consider ‘Frame Truncation’ to conserve your buffer size improve collection performance (Tools Menu, Options).
- Lookout for, and be aware of, context sensitive menu variations.
- Copy and paste portions of your capture into Excel, then calculate totals or chart data.
- Consider creating an Alias for IP addresses.
- Check out the Filters –> Color Filters.
- Get out of jail ‘Restore’
View menu –> ‘Window’ –> ‘Restore Default Layout’. - It’s worth checking the version number of the Network Monitor in the Server 2008 Control Panel. Go to Programs and Features, right-click on the Columns, choose ‘More’ and add the ‘Version’ tab.
Monitor Your Network with the Real-time Traffic Analyzer
The main reason to monitor your network is to check that your all your servers are available. If there is a network problem you want an interface to show the scope of the problem at a glance.
Even when all servers and routers are available, sooner or later you will be curious to know who, or what, is hogging your precious network’s bandwidth. A GUI showing the top 10 users makes interesting reading.
Another reason to monitor network traffic is to learn more about your server’s response times and the use of resources. To take the pain out of capturing frames and analysing the raw data, Guy recommends that you download a copy of the SolarWindsfree Real-time NetFlow Analyzer.
There is Also a Command-line Tool Called Nmcap.exe
For those who love the command-line, they can control the Network Monitor with the Nmcap executable.
You can use the same filters at the command line as seen in the Capture Filter GUI. Once you have perfected filters in the GUI you could copy and paste them into the Nmcap command-line. The syntax is /Frame <Your Filter>.
If you like this page then please share it with your friends
Microsoft Windows Server 2008 Topics:
• Server 2008 Home •Network Monitor • Free Syslog Analyser
• AD DC • Roles • Features • Hyper-V • UAC • IPv6 • GP Preferences
• SolarWinds Network Performance Monitor •Performance Monitor
