Introduction to Processor Bottlenecks
Processor usage (also called CPU usage) is the easiest bottlenecks for performance monitor to detect. What we are looking for is the percentage time that the processor is in use servicing an application, as opposed to just ticking over by running an idle thread. If the CPU is so busy that it cannot respond to requests, then the whole server’s performance soon deteriorates rapidly.
Processor Topics
- Processor: % Processor Time
- System: Processor Queue
- Multiple Processors
- Other Processor Counters
- Solutions to processor problems
♦
Types of Server
Database and email servers are the most likely to suffer from processor bottlenecks. On the other hand, file and print servers are less likely to be short of CPU power. However, large modern servers invariably have multiple symmetric processors so % Processor Time bottlenecks are becoming rarer than memory bottlenecks. That reminds me, always monitor the other major counters, Disk, Network and Memory.
If you discover a processor bottleneck, then use the process counter in performance monitor to identify which program or process is hogging the server. Also check out drivers and disk subsystems to pin point the source of the processor activity.
Note: there are two Performance Monitor counters with very similar names, processor and process, on this page we are investigating processor (CPU).
A Quick CPU Performance Check for Windows Server 2008
To get a quick view of the CPU, and more importantly, which processes are hogging the CPU, launch the Reliability and Performance Monitor. Click in the left hand pane on the highest band ‘Reliability and Performance, now you should be able to see the Resource Overview of the individual usage monitors. Finally, select CPU and click on the CPU column, you should see the images sorted into order of CPU % usage. Knowing which process (Image) is monopolizing the CPU should direct your search to find the bottleneck.
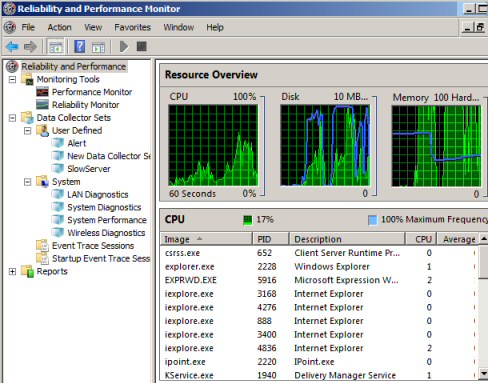
Another way of checking processor usage quickly is to call for the Task Manger, Performance Tab. Ignore spikes but check for high continuous CPU Usage History.
Guy Recommends: A Free Trial of the Network Performance Monitor (NPM) v12
v12
SolarWinds’ Network Performance Monitor will help you discover what’s happening on your network. This utility will also guide you through troubleshooting; the dashboard will indicate whether the root cause is a broken link, faulty equipment or resource overload.
Perhaps the NPM’s best feature is the way it suggests solutions to network problems. Its second best feature is the ability to monitor the health of individual VMware virtual machines. If you are interested in troubleshooting, and creating network maps, then I recommend that you give this Network Performance Monitor a try.
Download your free trial of SolarWinds Network Performance Monitor.
Processor: % Processor Time
In Windows Server 2008 the next step is click on ‘Performance Monitor’, see the above screenshot. In Windows Server 2003 launch Perfmon. In terms of troubleshooting, an overloaded processor has a distinctive and unmistakeable performance monitor profile. The % Processor Time trace looks like a curtain hanging down from an imaginary ceiling. See screenshot below.
Text books quote thresholds of between 70 – 85 percent for % Processor Time, the key point is that the counter is continuously high. It is normal for the trace to show a sharp increase when any program executes; you can safely ignore spikes.
Tip: Firstly, always monitor the big 4, in addition to the processor monitor, memory, disk and if possible, the network. Secondly, my specific point her is that if the % processor time is high, yet there is loads of available memory, then you truly have a CPU bottleneck. But if the Processor is high, but the system has run out of memory, then it many not be processor that is the weak link.
System: Processor Queue
The hardest part of using this performance monitor counter is remembering to go to the System object (not the Processor object). What I love about any queue counters is that it is easy to remember the threshold. The rule of thumb is that the threshold for a queue bottlenecks is 2.
Other Counters
You may also wish to examine DPCs Queue/sec. This is where the server was busy so it deferred processing a request. High or intermittent bursts of Interrupts /sec could indicate a hardware problem or a loose component.
Other Techniques for Performance Monitoring
If a quick look at the instantaneous data does not resolve your problem then you may wish to create logs of server activity over a 24hr period. For frustrating intermittent problems it may help you set alerts so that you can think about what was happening just before the problem occurs.
The advent of PowerShell means that you can check data from the command line, the key cmdlet is:
get-Process. With a little work you can control the output with ft (format table) followed by the names of the fields / columns / properties that you wish to study.
To avoid the possibility that Performance Monitor itself is affecting the results you could try remote monitoring, for this you could monitor the servers by running perfmon on a workstation such as Vista or Windows 7.
Multiple Processors
With multiple processors, it is reasonable to divide the System: Processor queue by the number of processors. So a twin processor could sustain a queue of 4.
The second rule of thumb is: you are allowed to divide the queue by the number of multiple components. (Processors, disks or NICs)
As a point of monitoring technique, twin or quad processors give you a chance to compare Processor: %Processor Time Instances, rather than just recording the _Total.
Guy Recommends : SolarWinds’ Free VM Monitor

The best feature of this new this new version of SolarWinds VM Monitor is that it checks Windows Hyper-V. Naturally, it still works with virtual machines on VMware ESX Servers. VM Monitor is a clever desktop tool that not only tests that your server is online, but also displays the CPU and memory utilization for each node.
It’s easy to install and to configure this virtual machine monitor, all you need the host server’s IP address or hostname and the logon info. Give this virtual machine monitor a try – it’s free.
Download your free copy of SolarWinds VM Monitor.
Other Processor Counters
1) Process and Thread
If you find a processor bottleneck you can pursue the cause by measuring the Process or even Thread object. What you are looking for is which instance of the Process is responsible for exhausting the processor.
2) System: %Privileged Time and Process: %Privileged Time.
The Windows 2003 operating system can execute, either in Kernel mode, which shows up as %Privileged Time, or User mode which corresponds to %User Time. This means that activities of programs like SQL or Exchange are charged to %User Time.
Here is a combination which would point to an I/O bottleneck, System: %Privileged Time > 20% and PhysicalDisk %Usage > 55%.
3) DPC
DPC means Deferred procedure calls – The processor is saying ‘I am busy I will do this low priority task later.’ Processor %DPC Time > 50% is suspicious and may indicate a network card bottleneck.
4) Processor\Interrupts/Sec
This counter isolates hardware problems. What you are looking for huge increases, 2 or 3 magnitudes of interrupts, for no apparent reason. To resolve such hardware problems, start by asking if anyone has updated a driver recently.
Solution to Processor Problems
Getting a second processor will work wonders for servers where the processor is being stressed. Upgrading the processor is another obvious solution for a stressed processor. For machines that already have multiple processors you could experiment with processor affinity and see if that makes the server run faster or slower.
When you order the next server consider making it a quad processor. Talking of new kit, when next you spec a new system, consider clustering. Often you need two reasons to break new ground. In addition to the obvious advantage of fault tolerance, clustering can gain extra performance through load balancing across the multiple processors.
Monitoring Processor Performance with PowerShell
There is a PowerShell cmdlet called Get-Counter, which provides an alternative technique for investigating computer processor activity. See more about Get-Counter.
If you like this page then please share it with your friends
More Help for Detecting Computer Bottlenecks
Download your eBook: The Art and Science of Performance Monitoring for only $5.25
![]() Learn the secrets of which counters to monitor. Master performance monitor logging, develop your skills with structured exercises and examples. Print out a copy to read, while you design logs and alerts to detect network bottlenecks.
Learn the secrets of which counters to monitor. Master performance monitor logging, develop your skills with structured exercises and examples. Print out a copy to read, while you design logs and alerts to detect network bottlenecks.