Review of SolarWinds NPM v11

NPM 11 represents SolarWinds' breakthrough into the $1B Application-Aware Network Performance Management market. I like its ability to zoom into network trouble spots, and I appreciate the comprehensive range of checks that it manages.
If you are appraising performance monitors, then I suggest you check the latest version: NPM v11.5
Topics for SolarWinds NPM v11
- Discover Network Devices
- Top 22 Features of NPM 11
- SolarWinds Network Performance Monitor Video
- System Requirements for SolarWinds NPM v11
- Network Performance Monitor Demo
Discover Network Devices
The first thing that Network Performance Monitor does is scour your environment for computer equipment that it can measure. NPM is designed to find all the devices supplied by leading hardware vendors as well as discover your virtual infrastructure including vCenters, datacenters, clusters, ESX hosts, virtual machines, and Hyper-V machines.
NPM v10.5 brought an advanced interface filtering capability to assist in importing new nodes and interfaces after the discovery process.
New: NPM v11 provides Deep Packet Inspection & Quality of Experience. This shows a summary of network and application performance metrics, this new technology identifies and reduction or change in an application's performance, furthermore, you can quickly see if the change is due to the application or the network.
This highly anticipated release is barely out the door, and Solarwinds has already won an award from network analysts.
Installing NPM v11
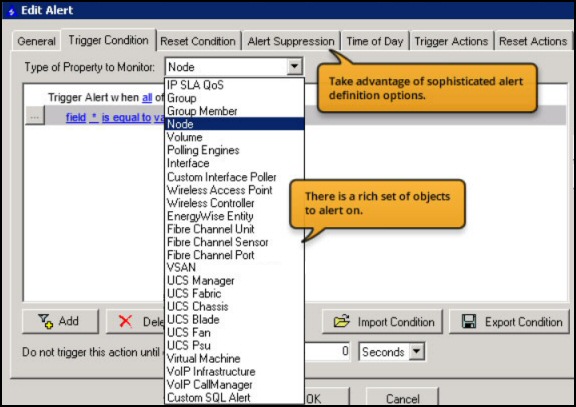
I am not the fastest installer, but it only took me an hour to get the Network Performance Monitor working. For me, the most fun was configuring intelligent alerting.
Remember, you can always get support from SolarWinds’ experts starting with the Thwack forum.
Review of SolarWinds NPM v11
NPM is geared to detecting network outages caused by broken links and faulty equipment. Because it produces network-centric views, it’s intuitive to navigate and easy to evaluate what’s working and what’s not. Perhaps the best feature of this network monitor is the way it suggests solutions. Moreover, if problems arise out of the blue, then you can configure NPM to notify members of your team what’s changed and how to fix it.
Under the bonnet the SolarWinds network monitoring software connects to the device and reports factors such packet loss, latency, discards, CPU, and memory for both SNMP and WMI-enabled devices.
Top 22 Features of NPM 11
From the remarkable list of features, my favourite is ConnectNow™ Network Mapping. I loved being able to drag and drop routers onto my network maps, and straight away see the connections to other devices and check their status instantly. See the other 21 features here!
Start Monitoring
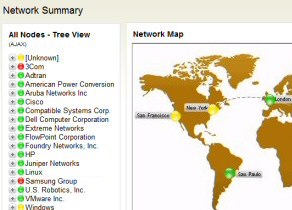
Once the NPM v11 setup is complete then it’s time to enjoy the monitoring. I should not say this, but the greatest fun for a techie is when something is wrong, but you can fix it easily. With SolarWinds NPM you start with a top-level network map and drill down through the red dots to discover more about the symptoms. The cause of the outage could be a broken physical link, a server that’s offline, or an application on a server that’s run out of resources. Try it now!

Possible Problems that Network Performance Monitor Detects

By using SolarWinds NPM you will avoid amateur mistakes such as blaming the network for latency problems, when it’s really an application on a server that is underlying cause. On a big network a sub-contractor may have changed a router at a distant site, or they patched a server, only for the upgrade to cause a new far-reaching glitch.
New Features in NPM v11
- Provides Network Response Time (NRT) and Application Response time (ART) for your critical applications.
- Identifies and classify over 1000 applications out of the box.
- Displays aggregate volume metrics per application / node.
- Contextually provides QoE data for nodes in Node Details subview
- You can create custom HTTP applications.
Perhaps your company wiz-kid introduced a new VoIP or wireless network, but did not realize the consequences for the rest of the corporate network? Again NPM will soon troubleshoot the root cause, and more than likely suggest solutions.
If you have deployed IP multicast in your environment then you will really like NPM 11's new IP multicast monitoring capability. NPM includes a top 10 multicast traffic resource that will show you the most talkative multicast groups and their status, a multicast group resource that presents the status of all detected multicast groups, historical multicast data, and multicast topology. By correlating this data with SNMP interface data, you can see who is responsible for traffic and identify potential capacity issues.
Often the most frustrating problems are those that appear only sporadically. For these annoying intermittent challenges SolarWinds has an analyzer with retrospective network-analysis capabilities. This historical data enables you to quickly isolate and resolve the irregular network problem.
Summary: NPM will discover the worst performing device on your network.
Network Performance Monitor Tactics
NPM Top 10 Lists
No performance monitor evaluation could be complete without a mention of the top ten lists. In fact, I find it mesmerising to observe how the nodes change position and move in and out of the top 10. My favourite category is response time, but you can also keep watch on:
- Response Time (see screenshot right)
- Wireless Clients by Traffic
- Wireless APs by Client Count
- Capacity utilization
- Memory usage
- CPU load
- Disk space volume
- Network traffic and Packet Loss
I really enjoy customizing the lists so that network monitoring works in just the way that I want.
Drill Downs
It soon becomes second nature to double click on the network maps and drill down through the site level to the server. From there you can even examine the resource usage of individual devices. However, if you are a newbie, this ability to locate problems is awesome and it feels like being at NASA’s mission control in Houston Texas.
The Underlying Polling Technology
SolarWinds NPM ships with a MIB database that covers all common network devices. However, if you do have a non-standard device NPM allows you to create a custom poller to monitor any SNMP-enabled device value that has a MIB. As with so many of SolarWinds' features, you can also adjust how the module collects and reports on the data.
For those with wireless networks, NPM now includes an integrated Wireless Poller. And for those with VMware, NPM reads host MIB information from each VMware ESX server and its corresponding virtual machines.
Role-based Access Control
Orion Network Performance Monitor (NPM) allows you to fine-tune who sees what information. Typically, at HQ you want to see everything, but perhaps you want the team at the Boston site to see only their own servers, and not start interfering with the New York operations. See also my review of SolarWinds SAM (Server & Application Monitor).
EnergyWise
It would probably be over-playing your hand to say to your MD that energy savings will pay for SolarWinds NPM, but nevertheless, controlling the energy consumption of Cisco EnergyWise-enabled network devices will reduce costs, and could be a clincher in persuading the financial director to buy SolarWinds. For the techie it’s just an interesting and worthwhile challenge to reduce energy consumption and keep the server rooms cooler. Free trial download of SolarWinds NPM v11
Time to Create Baselines
Creating baselines of network activity is a good litmus tests of a well run company. Thus, one unexpected side-effect of using SolarWinds NPM is that the techies could have more time on their hands! As a manager you can take advantage by commissioning them to show you baseline charts. The trouble with fire-fighting is that you are never quite sure what is normal. By having a ‘feel’ for the network backed up by stats for off-peak usage, you can soon pin-point abnormalities. As a result you can either prevent latency problems, or else cure them quickly before the users realize there is something not quite right.
To support this pro-active approach to network management SolarWinds provides reports which are both comprehensive and interesting for the techie. One common side-effect of baseline analysis is that ideas for improvements leap out of the charts, for example, load-balancing servers – one of my favourite ‘cost nothing’ tactics.
SolarWinds Network Performance Monitor Video
Here is a good way to see Network Discovery and Mapping in action:
See the Network Performance Monitor (NPM) Demo
Review of NPM 11
Version 11 introduces the new Quality of Experience (QoE) dashboard which gives our customers an at-a-glance ability to determine whether there may be an issue with the network, or if it's an application problem. Other features include:
- Hardware Health Monitoring.
- Drag-and-Discover Interactive Charting.
- Multiple Universal Device Pollers (UnDP) on the same chart resource
- Out-of-the-box polling support for F5 BIG-IP and HP wireless MSM760/765 devices.
- Web Console User Auditing.
Thwack Forum
Please note that SolarWinds are using your thwack posts as examples because they’re publicly available for us to point to, but they’re not the sole determiner of release content prioritization. We know you can’t access our minds or our internal feature tracking systems, but if you could, you’d see we also take into account all the great feedback you’ve given us in 1:1 interviews, feature requests submissions, beta posts, through our support organization, etc. to help us decide what goes into each release.
So, regardless of which method you prefer to provide us your feedback, please keep it coming! SolarWinds are absolutely listening. Join the NPM Thwack forum.
Value for Money in Performance Monitoring
It’s only fair to point out when reviewing SolarWinds performance monitors is that the full package represents a big investment. Indeed, there are cheaper performance monitoring packages, but they don’t have the data collection and storage capacity of SolarWinds NPM v11. Actually, my biggest discriminator in determining whether a product is cheap or expensive is the quality of the support staff. Some people say SolarWinds is expensive, but nobody complains about the troubleshooting skills of SolarWinds’s technical staff.
More good news is that SolarWinds offer of a trial version of NPM v11 so that you can see if this performance monitor really would save you money in the long run. Another way of reducing costs is to select only the NPM modules that you need. Once you see the benefits, particularly if you are trying to track multiple sites, then it's easy to justify adding more options later.
There are cheaper alternatives to each SolarWinds module, but one hidden benefit is that all the modules integrate with each other, which makes it so much easier for reporting and root cause analysis. Also most rival products don’t supply the level of detail that you get by drilling down through the network maps.
Log & Event Manager (LEM)
If you are looking for an application that can provide automatic reaction to events, then check-out another of SolarWinds’ apps namely the Log & Event Manager. In addition to analyzing logs from routers, anti-virus software and Windows logs on the servers, LEM can also help you achieve IT compliance. Review SolarWinds LEM
System Requirements for SolarWinds NPM v11
- Operating Systems for Orion: Windows 2003, 2008 and 2012 Server, including R2 (32-bit or 64-bit).
Please note, that you also need to install IIS and .NET Framework 3.5 - Resources: CPU Speed: 3.0 GHz; Hard Drive Space: 30 GB; Memory: 4 GB
- Database: SQL Server 2005 SP1, or SQL Server 2008 (Express, Standard, or Enterprise)
Summary: Review of SolarWinds Network Performance Monitor
NPM is ideal for discovering network trouble spots. When I tested NPM I was surprised how much there was to learn about network technologies, fortunately the SolarWinds network performance monitor helped me understand and appreciate how devices communicate. In a nutshell, NPM helps you detect problems before they develop into a full-scale company-wide outage.
It took me 90 minutes to setup NPM, however, most experts take less than an hour to get started. How long will it take you?
Full Reviews of the SolarWinds Licensed Family of Applications
Here are Guy’s comprehensive evaluations, comments and recommendations for SolarWinds licensed products. Each application offers a 30 day trial of a fully functional program, so check out the download links provided.
• Review of SolarWinds NPM • SolarWinds SAM Review (Apps) • AppInsight for Exchange
• SolarWinds NCM (Configuration) • Web Performance Monitor • Performance Monitor
• User Device Tracker • Application Monitor • Orion SLA Monitor • SolarWinds IPAM 4 • Home