Review of SolarWinds PerfStack
End-to-End IT Performance Supervision
The concept behind SolarWinds' Orion Platform is to give you a view of the full protocol stack. You can analyse what's occurring from your network to the web and into the cloud.
What gives you control is SolarWinds impressive dashboard, it will show you all the network, storage and apps metrics you need to understand system's performance.
This new method of correlating, then viewing data, comes courtesy of SolarWind's NPM 12.1 and SAM 6.4. In a nutshell, PerfStack sifts through the vast data to focus on what's important to solve a particular problem.
Deep-dive Visibility of Your System
What you want for root cause analysis, is a unified view from the network to the web, and this is exactly what the Orion Platform is designed to deliver. PerfStack does this by connection metrics on a single time-line.
- Investigate detailed metrics for application health and performance.
- Balance performance and utilization for storage and virtual resources.
- Extract wait-time data for database performance tuning.
- Visualize network performance, traffic, and configurations.
Cloud Visibility
From user experience to database wait-time, you can monitor the health and performance of your cloud applications, underlying infrastructure, and network, all in the same view as your on-premises systems.
Take the time to investigate how NetPath can monitor your complete network path to your cloud environment. It's also easy to check wireless controllers and access points. It doesn't matter if your cloud infrastructure is agent-based, agentless or API-sourced, NetPath will display the metrics in an easy to read format. It's just as easy to inspect database performance, whether its AWS (Amazon Web Server) or Microsoft's Azure.
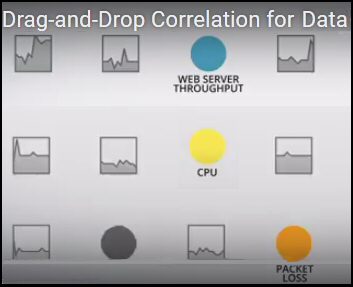
Drag-and-Drop Correlation of Your IT Data
See how to experiment with the data correlations. For example,
Web Throughput, CPU, Packet Loss and IOPS (Input/output operations per second)
Drag-and-Drop Cross-Stack Correlation
It's great to be able to go back in time and thus investigate the cause of unexpected system events in the past. The PerfStack dashboard allows you to correlate time series data to gain insights into system and application behaviour. The dashboard will collect information from network, host, application, virtualization, and storage elements across all hybrid IT infrastructures. Just drag and drop any metric into a composite dashboard; compare disparate metrics, look for patterns and then identify the root cause of your problem.
Where Next
Investigate SolarWinds' head geek Patrick Hubbard's Lab #52.
Summary: Review of SolarWinds PerfStack
Orion has a modular architecture which includes common services, including security, UX framework, alerting, reporting, and of course data acquisition.
SolarWinds products such as NPM, NCM, NTA, and SAM plug into this framework and leverages these platform services. At the top layer is PerfStack (and AppStack) they inherit the lower components in the Orion Platform.

See Also: SolarWinds Server Health Monitor
Server Health Monitor is another free tool from SolarWinds. It is a chopped-down version of NPT, which shows you the performance of server components such as power supply, temperature, battery and fan speed. See more on Server Health Monitor
Additional Free and Trial SolarWinds Network Software
Here are nifty gadgets which I have enjoyed testing on my network. Some are completely free, while other downloads are trial versions of the full product. I think SolarWinds have a great strategy, namely, supplying a free utility, yet providing a big-brother suite of programs for larger organizations.
• Mobile IT Admin App • SolarWinds PerfStack • Network Monitor for Dummies • Home
• Permissions Analyzer • Review Alert Central • Free NetFlow Analyzer • SolarWinds Firewall Browser
• Server Health Monitor • SolarWinds Web Help Desk • Wireshark Response Time Viewer • GNS3