Review of SolarWinds NPM v11.5
NPM is designed for detecting network outages caused by broken links and faulty equipment.
Awesome is an overused word, but it describes the power that that SolarWinds agents and pollers give to this Network Performance Monitor.
Thanks to NPM, you really will get an answer to any question concerning the performance of your network devices.

Topics for SolarWinds NPM v11.5
- Discover Network Devices
- New Features in NPM 11.5
- Web-based Alerts in the NPM Dashboard
- Review of SolarWinds NPM v11.5 in Action
Discover Network Devices
The first thing that NPM does is scour your environment for network devices and computer equipment supplied by leading hardware vendors. From the SysOIDs it collects metrics on your virtual infrastructure, including vCenters, datacenters, clusters, ESX hosts, virtual machines, and Hyper-V machines. The intuitive dashboard then displays:
- Bandwidth utilization
- Packet loss and errors
- Latency and discards
- CPU, and memory
- Much, much more besides …
NPM v11 brought Deep Packet Inspection & Quality of Experience (QoE). Its key feature is the ability to identify any reduction or change in an application's performance, this means you can quickly see if the change is due to the application or the network.
NPM 11.5 auto-detects devices and compares what it finds with a list of 1200 profiles, and QoE v 2.0 tells you what is being seen on the wire. This latest version also allows you to enable (or disable) health monitors at individual notes.
New Features in NPM 11.5

Wireless Heat Maps
You supply the office floor plan, and NPM v 11.5 will use triangulation of wireless points to record the strength of the signal in each room; you can see a display the resulting heat map on the NPM console. The benefit of knowing where signal strength is low, is that you can reposition the wireless points to improve network coverage.
See a review of wireless heat maps.
Built-in Capacity Planning
SolarWinds Network Performance Monitors have long been able to measure resources such as storage capacity, memory usage and network bandwidth. What's new in NPM 11.5 is algorithms to analyze the infrastructure's rate of change, together with the pattern of change; as a result you see in the dashboard predictions of dates when resources will reach capacity. Actually, you get two predictions, one based on average usage, and another on peak usage.
Duplex Mismatch Detection
Sometimes Auto-detection of whether a device is using full or half-duplex fails. Resulting mismatches are a notorious source of unnecessary increases in network latency. The good news is that NPM employs its topology maps to detect both definite and possible duplex mismatches.
Automatic Dependency Mapping
Using the existing CDP & LLDP information, NPM 11.5 automatically builds parent-child relationships so that downstream events are suppressed when upstream devices are down.
Web-based Alerts in the NPM Dashboard

In addition to monitoring, a key part of NPM is alerting when problems arise. Your strategy here is either to activate some of the dozens of pre-configured alerts, or to 'Add a New Alert'. Creating your own alert in the Web-based interface is fun, alerting now offers new features such as separating the "scope" of an alert from its "trigger".
In version 11.5 SolarWinds technicians have redesigned the alerting engine. The improvements go way deeper than just a new web-based interface. For example, they have given thought to reducing unnecessary alerts by allowing us to configure the scope of an alert, thus rather than selecting all servers, you could alert only on Linux servers on a particular subnet.
The web alerts also provide the opportunity to configure alerts so that only the member of staff on duty is emailed or paged at any particular time.
Remember, you can always get support on alerts and other aspects of NPM from SolarWinds’ experts starting with the Thwack forum.
System Requirements for SolarWinds NPM v11.5
- Operating Systems for Orion: Windows 2003, 2008 and 2012 Server, including R2 (32-bit or 64-bit).
Please note, that you also need to install IIS and .NET Framework 3.5 - Resources: CPU Speed: 3.0 GHz; Hard Drive Space: 30 GB; Memory: 4 GB
- Database: SQL Server 2005 SP1, or SQL Server 2008 (Express, Standard, or Enterprise)
Installing NPM v11.5
I am not the fastest installer and it took me 90 minutes to setup NPM, however, most experts take less than an hour to get started. How long will it take you to install NPM?
SolarWinds Network Performance Monitor Additional Benefits
Integrate Microsoft Active Directory
Take advantage of your existing Microsoft Active Directory and permit selected users to log in to SolarWinds NPM. I like to enable AD pass-through login and thus bypass the login screens.
Incorporate Microsoft System Center Operations Manager (SCOM)
SolarWinds provide a free NPM Management Pack that enables integration with Microsoft System Center Operations Manager (SCOM) 2007 and Microsoft System Center Essentials 2007.
Monitor Mobile Views for iPhone®, Blackberry®, and Android™
Study network performance from mobile Web browsers such as iPhone, Blackberry, and Android.
Integration with other SolarWinds Management Solutions
NPM integrates with all network, server and application management solutions from SolarWinds, including Server & Application Monitor (SAM), Network Configuration Monitor (NCM), NetFlow Traffic Analyzer (NTA), and VoIP & Network Quality Manager (VNQM).
In case you are wondering, NPM also integrates with SolarWinds Virtualization Manager and also SolarWinds Web Help Desk to allow auto-population of network alerts into service desk tickets.
Log & Event Manager (LEM)
If you are looking for an application that can provide automatic reaction to events, then check-out another of SolarWinds’ apps namely the Log & Event Manager. In addition to analyzing logs from routers, anti-virus software and Windows logs on the servers, LEM can also help you achieve IT compliance. Review SolarWinds LEM
Review of SolarWinds NPM v11.5 in Action
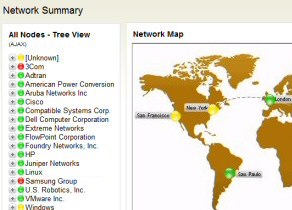
Once the NPM v11 setup is complete then it's time to enjoy the monitoring. I should not say this, but the greatest fun for a techie is when something is wrong, but you can fix it easily. With SolarWinds NPM you start with a top-level network map and drill down through the red dots to discover more about the symptoms. The cause of the outage could be a broken physical link, a server that's offline, or an application on a server that's run out of resources.
Possible Problems that Network Performance Monitor Detects
By using SolarWinds NPM you will avoid amateur mistakes such as blaming the network for latency problems, when it’s really an application on a server that is underlying cause. On a big network a sub-contractor may have changed a router at a distant site, or they patched a server, only for the upgrade to cause a new far-reaching glitch.
Summary: NPM will discover the worst performing device on your network.
What's New in NPM 11.5 Video
Here is a good way to see the latest thinking in network performance monitoring with SolarWinds expert Rob Hock:
See the Network Performance Monitor (NPM) Demo
Value for Money in Performance Monitoring
It’s only fair to point out when reviewing SolarWinds performance monitors is that the full package represents a big investment. Indeed, there are cheaper performance monitoring packages, but they don’t have the data collection and storage capacity of SolarWinds NPM v11.5. Actually, my biggest discriminator in determining whether a product is cheap or expensive is the quality of the support staff. Some people say SolarWinds is expensive, but nobody complains about the troubleshooting skills of SolarWinds’s technical staff.
More good news is that SolarWinds offer of a trial version of NPM v11.5 so that you can see if this performance monitor really would save you money in the long run. Another way of reducing costs is to select only the NPM modules that you need. Once you see the benefits, particularly if you are trying to track multiple sites, then it's easy to justify adding more options later.
There are cheaper alternatives to each SolarWinds module, but one hidden benefit is that all the modules integrate with each other, which makes it so much easier for reporting and root cause analysis. Also most rival products don’t supply the level of detail that you get by drilling down through the network maps.
Summary: Review of SolarWinds Network Performance Monitor
SolarWinds could have designed Network Performance Monitor (NPM) to answer the question: 'Is this latency problem due to the network, or the application server?'
Actually, the NPM dashboard displays so much more; thanks to a comprehensive range of pollers and agents you can zoom-in to the computer network trouble spot and investigate the underlying problem.
See Also: SolarWinds Server Health Monitor
Server Health Monitor is another free tool from SolarWinds. It is a chopped-down version of NPT, which shows you the performance of server components such as power supply, temperature, battery and fan speed. See more on Server Health Monitor
Full Reviews of the SolarWinds Licensed Family of Applications
Here are Guy’s comprehensive evaluations, comments and recommendations for SolarWinds licensed products. Each application offers a 30 day trial of a fully functional program, so check out the download links provided.
• Review of SolarWinds NPM • SolarWinds SAM Review (Apps) • AppInsight for Exchange
• SolarWinds NCM (Configuration) • Web Performance Monitor • Performance Monitor
• User Device Tracker • Application Monitor • Orion SLA Monitor • SolarWinds IPAM 4 • Home