NPM – Solarwinds’ Network Performance Monitor
The best way to see Solarwinds Network Performance Monitor in action is to take a walk through of the demo. Check for yourself what this award winning network management solution can do for your setup.
Click here to check out SolarWinds online SolarWinds Network Performance Monitor Demo.
1. Installation Requirements
Install on Windows Server; you need an SQL Database, but don’t worry it comes with SQL Express.
2. How Does NPM Poll?
Using either ICMP, SNMP or WMI
3. Access the NPM Features Via These Tabs
a. Home (See tab below)
b. VMware

4. Home Page
a. General overview of all nodes on your network, which we will drill down in a moment
b. Example of the types of devices we can monitor.
5. Node Details
a. Expand Cisco > Cisco Core Router (you can hover over the specific node in the tree view to show a snapshot of that nodes operability)
i. left side = real-time information
ii. right side = historical information
iii. here you can monitor specific information or each node, including:
bandwidth utilization and the interfaces that are being monitored on that node
- Packet loss
- Average response time
- Latency
- Disk errors/alerts
- CPU load
- Memory utilization
iv. stacking multiple interfaces on a single chart
v. Network Topology shows you what port is connected to what device
6. Interface Details
a. Click GigabitEthernet 0/1 – link to PIX (at the top right of the Node Details page)
i. This view will show your interface utilization information such as, Receive & Transmit utilization, errors & discards, or total bytes transferred.
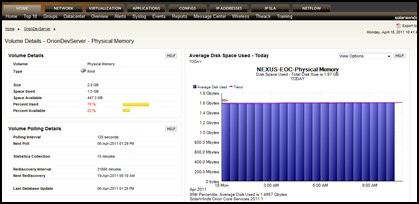
7. Volume Details
a. Go back to Home > Expand Windows > Expand OrionDevServer
i. the first view is back to the Node you can see it’s a Windows server and the interfaces being monitored
ii. You can also see the Volumes that are being monitored. (Volume is a physical disk drive or physical or virtual memory)
b. Drill into Physical Memory
i. You can see the size of the drives, space available, % used, % available
Click here to check out SolarWinds online SolarWinds Network Performance Monitor Demo.
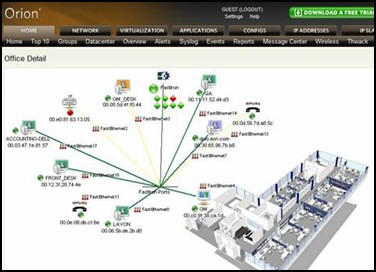
8. MAPS
a. Back on the Home Page – On the right, you have a customizable map that shows your network distribution by Geographic location, along with bubbles indicating a operating or degraded state
b. US Map > US Operations Map > Austin > Headquarters
9. Customizing HTML resources:
a. One of the cool features of NPM is the customizable HTML resource at the bottom of the Home page, including:
i. Open HelpDesk Tickets (we use LANDesk, but you can use anything)
ii. Dynamic map or picture (we show the current US radar, which could be a component that’s affecting your network in a particular area)
10. Top 10 View
a. view of all the Top 10 Issues on your network
b. the resources are customizable, so if you want the a Top 25 view, just simply edit that resource
c. Click Top 10 on the Home Menu Bar

11. Groups View
a. Groups allows you to define any logical grouping of your nodes, interfaces, volumes, applications, … If there is ever a problem with any part of that group we will tell you the ROOT CAUSE.
b. Click Groups on Home Menu Bar (drill into any group to demonstrate the ROOT CAUSE)

12. DataCenter View
a. This view that has been created from the ‘Home’ tab to demonstrate the level of customization.
b. shows core datacenter nodes, along with a customizable core map
c. helpful in identifying your VSAN (virtual storage area network) traffic and historical interface aggregate chart data
d. Click Data Center on the Menu Bar
13. Overview View
a. This view is accessed via the Network tab and shows an overview of all of your nodes and interfaces and the ability to change the view types.
b. nodes and interfaces and their operability
c. you can hold your mouse over each icon for details, again most of which would require additional work to find if you did not have NPM
d. data key (legend) at the bottom
e. Click Overview on the Menu Bar
14. Alerts
a. N.B. This is not available via the Web interface.
Click on Alerts on the Home Menu Bar
i. Alerts view shows all of your active alerts
ii. Ability to identify any thresholds and anything being monitored and alert on it.
iii. Over 14 different actions when an alert is triggered
iv. Alert Escalation ability

15. Syslog and Traps:
a. Click on the Message Center view under Home
i. NPM includes a syslog and trap receiver.
ii. Alert and report on those syslog or traps.
16. Reports:
a. Click on Reports on the Home Menu bar
b. tons of reports included out of the box.
c. Easy to modify or create on your own
d. Ability to have reports emailed on scheduled interval
e. Example Report to show – Home > Reports > Node Reports > Inventory > IOS Versions of Cisco Devices

17. THWACK
a. Click on thwack on the Home Menu Bar
b. online community for answering software questions and troubleshooting
c. useful information, valuable tools and resources
d. allows you to join and talk to other SolarWinds customers and network engineers, as well as directly to Solarwinds personnel (e.g. developers and product managers).
18. WIRELESS
a. Click on Wireless on the Home Menu Bar
b. Wireless monitoring is INCLUDED with NPM
c. Capture statistics such as Access Points, SSIDs, Clients on the wireless network, and traffic throughput.
d. SUPPORT FOR WIRELESS CONTROLLERS *** (Cisco, Aruba, Meru)
e.

19. The NETWORK Tab
This provides additional features such as VSAN support, Cisco UCS, Fiber Channel, and EnergyWise
a. Click Network tab to showcase

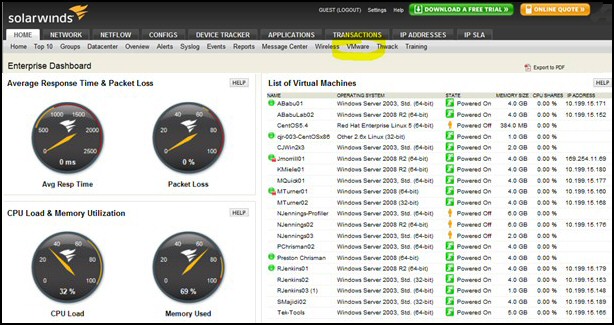
20. The VMware Tab
This is also included in SolarWinds NPM and provides bird’s eye view of your Virtualization Infrastructure. You can view the Cluster, Data Center, ESX Host, or VM level
a. Click on Home (tab) > VMware > Expand P390SVR-DT > SE & PMM Datacenter > Cai-VM-02
i. Displays the Virtual Machines on the ESX Host, the state they are in, and the resources they are using.
ii. Scroll to the bottom of the page to see the stacked graphs of CPU, Memory consumption, and network traffic for each VM.
Get started with 3 simple steps:

More Free and Trial Network Software
Here are Guy’s evaluations, recommendations and download links for handy utilities.
• SolarWinds SAM Review • NPM Demo • NCM Review • Config Generator • LANsurveyor Review
• Free Network Traffic Analyzer • Review Kiwi Syslog Analyzer • Bandwidth Analyzer Pack
• SolarWinds Application Performance Pack � Network Engineers Toolset • SolarWinds WMI Tool