Introduction to Performance Monitor Logs
Creating and interpreting logs is the key to monitoring your Windows 2003 servers and network performance. The logs are the central blank in your strategy to discover and remove bottlenecks from your system. This page concentrates on creating a log of your server’s activity, however there are other tactics, for example, creating Alerts.
Our first mission is to collect data about your server’s memory, processor, disks and network. In addition to monitoring the Windows Server operating system, we often need to collect SQL and Exchange counters. The benefit of creating a log is that we can analyse hours of performance at leisure. The alternative of constantly watching the System Monitor soon wears off.
Another advantage of studying logs rather than viewing System Monitor is that you can use logs to track trends. If necessary, you can go back months to confirm a change in resource usage. Moreover, if you keep old logs then you can see precisely when a problem originated.
Performance Log Topics
♦
Performance Monitor Logs
Whilst this page will show you how to create logs with Performance Monitor, it does assume that you are familiar with Windows 2003’s System Monitor interface. (See here for a refresher)
Creating your First Log
The performance monitor log, holds all the counters of all the objects and that you wish to track. The advantages of a log over the System Monitor is that the log captures the data permanently in an actual file.
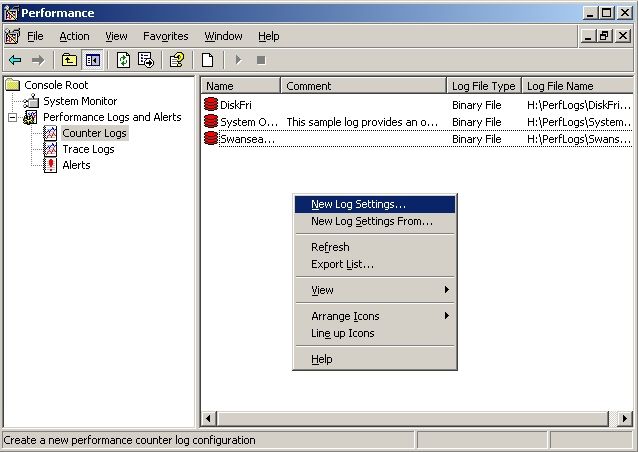
To create a log, open performance monitor, go down past System Monitor to Performance Logs and Alerts, select Counter Logs. (See Diagram 1)
When the dialog box appears, give the log a meaningful name, for example the name of the server or object. The first time you save a log you are prompted to create a folder, accept Perflogs as the directory name.
Next you have a choice of button, either click on Add Objects or click on Add Counters. Let us begin with Add Objects, because it is simpler and you will not miss any instances. (See Diagram 2)
An old trick is to use the control key as you pick multiple counters.
Setting the time interval is tricky. The trade-off is event accuracy versus log disk space. My advice is to leave the timing at the default 15 seconds – for now.
When you are ready, click the Add button (down at the bottom of Diagram 2.) If you make a mistake you can always go back, select the log Properties and adjust the selections.
I like the way that as soon as you have finished creating a log, the icon color turns from red to green. You probably guessed that a right-click followed by Start or Stop, acts like a tap turning the log collection on or off.
With experience, you can be more choosy and pick only Counters you really need. The benefits of selectivity are, that you will quickly find the data in the log, and that the log will consume less disk space.
Leave the log for 5 minutes and then move on to the next section – viewing your log.

Diagram 1 (Above)

Diagram 2 (Above)

Guy Recommends: A Free Trial of the Network Performance Monitor (NPM) v12
v12

SolarWinds’ Network Performance Monitor will help you discover what’s happening on your network. This utility will also guide you through troubleshooting; the dashboard will indicate whether the root cause is a broken link, faulty equipment or resource overload.
Perhaps the NPM’s best feature is the way it suggests solutions to network problems. Its second best feature is the ability to monitor the health of individual VMware virtual machines. If you are interested in troubleshooting, and creating network maps, then I recommend that you give this Network Performance Monitor a try.
Download your free trial of SolarWinds Network Performance Monitor.
Logman
For those who like the command prompt, there is a utility called: logman. Personally, I find the syntax too difficult for regular use, but I agree with ‘Mad’ Mick, you can use logman in batch files.
Viewing your log 
Trust me! Have faith that your performance monitor log has collected reams of data. I say this because every time I examine a log, for a split second I think, ‘It’s empty’.
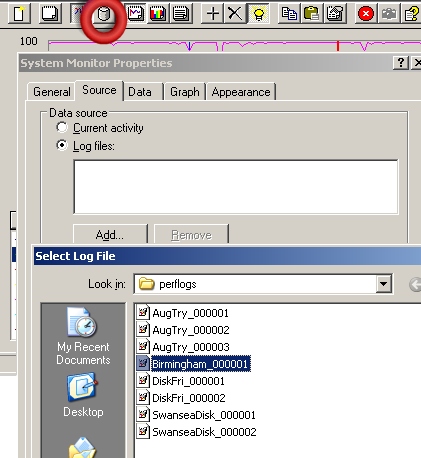
- Firstly stop your log by right-clicking on the green icon. Remember that the system Monitor normally collects live data, well now we are going to persuade it to interrogate the log we created earlier.
- The first of two crucial steps is to select the Log icon, see the red ring in Diagram 3. Next find your log file in the Perflogs folder and press OK.
- For the second crucial step, go to the + and select the Object and Counters you wish to examine. Start with Processor: % Processor time then press on Add. You should now see a static line, see Diagram 4. Success!
- At your leisure, you can add more Objects and Counters, as you do so, note that the only objects available are those you choose when the log was created. This is an important lesson for when you create future logs.
- After you have added the counters and admired their traces, you will be struck by the similarity between the Log view and a pure System Monitor capture. The only difference is that the logs are static.
- If you wish to adjust the time frame, right-click any where on the graph, click the Source (Tab) and slide the grey bar underneath the Time Range.
 Guy Recommends: SolarWinds Engineer’s Toolset v10

This Engineer’s Toolset v10 provides a comprehensive console of 50 utilities for troubleshooting computer problems. Guy says it helps me monitor what’s occurring on the network, and each tool teaches me more about how the underlying system operates.
There are so many good gadgets; it’s like having free rein of a sweetshop. Thankfully the utilities are displayed logically: monitoring, network discovery, diagnostic, and Cisco tools. Try the SolarWinds Engineer’s Toolset now!
Download your fully functional trial copy of the Engineer’s Toolset v10
Save Settings As
To re-use your counters for future logging, right-click the counter in the Performance Monitor console, then select Save Settings As; note the .htm format. As a bonus, you can now open the file in Internet Explorer and track the System Monitor. I guess everything is web based these days.
Log Formats
Text File: – Tab or Comma Delimited. Best for 95% of all counter logs.
Binary: – Useful for intermittent data.
SQL Database: You need the name of an existing SQL database. Used for recording lots of data about lots of servers, the enterprise scenario.
The next step – Schedule those logs
Create a schedule so that logs start automatically early in the morning, and run thought the day until everyone has gone home. In fact, you may want to run the log for the full 24 hrs, I once used a log to un-earth a problem caused by backup in the middle of the night.
You may wish to run a test log for 10 minutes and check how big it gets, then multiply up by how many hours you wish to run the log. As a result of your test, you may want to move the log to a folder on a partition with more free space.
To configure a schedule, right-click your counter log, properties, Schedule Tab.
Summary of First Log
With a little guidance you will soon be able to create Performance Logs for your Windows 2003 servers. Once you learn the technique and understand the menu items, you will soon be creating logs to check for bottlenecks on your network.
If you like this page then please share it with your friends