Introduction to Exchange 2003 – Performance Monitoring Advice
Network performance monitoring is a complex subject, some would say a black art. Many network administrators, who are highly skilled at other Exchange 2003 server tasks, have relatively little experience with Performance Monitor logs. By finding and removing bottlenecks, not only will you speed up your server, but you will also learn a great deal about how Exchange processes and objects operate.
Topics for Performance Tuning in Exchange 2003 Server
♠
Key Questions before you start monitoring
Set Yourself Goals – make a plan
Decide what you want to get out of network performance monitoring. For example:
a) To investigate slow response times when users retrieve their email.
b) To check if there really is a memory bottleneck on the Abc server.
c) To calculate how many more mailboxes you can run from the Xyz server.
So begin your performance monitoring project by writing down your goals.
Collect background information
Make a preliminary investigation of how people use your Exchange 2003 network. Create a spreadsheet and calculate factors such as, average mailbox size ,the average number and size of the emails users receive. I am sure you can add in more factors.
Exchange 2003 relies on Windows 2003 for controlling memory, CPU, disk and network. Find out the specifications for your Exchange Servers, some people are shocked at how little RAM they really have; others are pleasantly surprised that they have 4 processors not 2.
Detect Bottlenecks
Performance monitor’s main job is to look for network bottlenecks, or put another may, to identify resources in short supply. However, start your monitoring by creating a baseline so that you can compare 9-5 activity with an off peak reference point.
Exchange 2003’s store.exe usually consumes most of the server’s available memory. So, always check for bottlenecks in this order, memory, processor, disk and network. Seek the root cause of any bottleneck, for example high disk activity could mask an underlying memory shortage. What is happening here is the disk is paging, rather than performing useful work such as writing to the exchange databases. Understand that a spike of activity is normal, whereas continuous high levels indicate a bottleneck.
Look for solutions
Keep in mind what you can do realistically to improve Exchange’s performance, for example, buy more RAM, add another CPU. What I find most satisfying is discovering cost-nothing solutions, for example load balancing by moving 200 mailboxes to the other Exchange server, defragging the database or adding the /3GB switch to boot.ini.
Guy Recommends: A Free Trial of the Network Performance Monitor (NPM) v11.5
v11.5
SolarWinds’ Network Performance Monitor will help you discover what’s happening on your network. This utility will also guide you through troubleshooting; the dashboard will indicate whether the root cause is a broken link, faulty equipment or resource overload.
What I like best is the way NPM suggests solutions to network problems. Its also has the ability to monitor the health of individual VMware virtual machines. If you are interested in troubleshooting, and creating network maps, then I recommend that you try NPM now.
Download a free trial of SolarWinds’ Network Performance Monitor
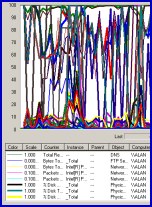
Interpreting Log Data
When you install Exchange 2003 server (or SQL) as part of the setup you get more counters in Performance Monitor, for example MSExchangeIS. The corollary is that if you don’t have Exchange 2003 installed, then you won’t see the counters that I discuss later.
The biggest problem that you face is interpreting the log data. What everyone wants is more ‘rules’ such as : If Processor % time is greater than 80% = bottleneck. Unfortunately, interpreting the log charts produced is rarely that simple. It’s relatively rare that you can pin down a threshold with one value and say: ‘more than x and you have a bottleneck’.
In my case, it’s not reluctance to tell you what I know; more that Exchange is so complex that it’s difficult to give hard and fast advice without knowing your situation. For example, take my rule of thumb for a queue, any queue; Guy says more than 2 object in a queue means you have found a bottleneck. Now take the case of where the disk queue has a value of 3. I can hear you thinking: ‘Guy says we have a bottleneck’, however it turned out the server had quad disks with 4 spindles, so the queue value should really be 0.75 – well under the threshold. This is why you really must examine many factors before you can be sure you have isolated the bottleneck.
Is performance monitoring a science or a black art?
The eternal question art or a science? A scientist may say, monitor all counters for Memory, Processor and Disk every 5 minutes for 24 hours. Where as an artist may say, monitor those big 4 objects every 30 seconds for 10 minutes. Next, the artist would select a subset of the most interesting counters and maybe throw in some extra counters such as MSExchangeIS. Finally an artist would set the log to monitor every 8 minutes from dawn ’till dusk. My point, stay flexible and keep looking for improvements in your monitoring.
One of the pleasant side effect of analyzing Performance logs, is that the counters teach you so much about how the Exchange email system work. For example caching, memory, information store.
When you begin climbing the Performance Monitor mountain, the first few steps are really steep. Don’t give up because as you build skill, so the path gets easier.
Summary
Most people find Performance monitor is a difficult tool to master. If you persevere with creating logs and analysing the data, you will be rewarded with a more efficient Exchange 2003 server. Moreover, as you experiment with Performance counters, so you learn about the underlying Exchange process, for example information store, memory and routing.
Download your eBook: The Art and Science of Performance Monitoring for only $5.25
![]() Learn the secrets of which counters to monitor. Master performance monitor logging, develop your skills with structured exercises and examples. Print out a copy to read, while you design logs and alerts to detect network bottlenecks.
Learn the secrets of which counters to monitor. Master performance monitor logging, develop your skills with structured exercises and examples. Print out a copy to read, while you design logs and alerts to detect network bottlenecks.