Introduction to Exchange 2003 – Processor Performance
It’s always a pleasure to monitor the % processor time because it’s so easy to spot a bottleneck. I suggest not only monitoring the processor, but also checking individual processes so that you judge which program is hogging the CPU.
Topics for Processor Performance in Exchange 2003 Server
- Monitoring Processor Objects
- Solutions to Processor Bottlenecks
- Specific Processor Counters to Monitor
- Summary
♠
Monitoring Processor Objects
 When the processor is the bottleneck, it gives a most distinctive trace. Do not be too worried about a processor time threshold of 75, 80 or even 90% just look at the pattern. If the graph looks like a drunken curtain hanging from the ceiling, then that processor is your bottleneck. On the other hand, if all you get is a series of spikes starting from a 20% or 30% baseline, then look elsewhere for a bottleneck.
Solutions to Processor Bottlenecks
If you do find that the processor is the bottleneck, it’s not particularly easy to fix. While it’s easy to say, ‘get more or faster processors’, there are often practical difficulties involving the motherboard. So, turn to lateral thinking for a solution. I would start with offloading services, for example printing. Also, if you are indexing public folders or mailstores, then perhaps the users can forgo faster searches. Another solution would be to move mailboxes to another server.
 Guy Recommends: The SolarWinds Exchange Monitor
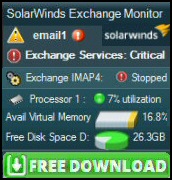
Here is a free tool to monitor your Exchange Server. Download and install the utility, then inspect your mail queues, monitor the Exchange server’s memory, confirm there is enough disk space and check the CPU utilization.
This is the real deal – there is no catch. SolarWinds provides this fully-functioning freebie, as part of their commitment to supporting the network management community.
Free Download of SolarWinds Exchange Monitor
Specific Processor Counters to Monitor
Note that there are two counters with a very similar name, Processor, and Process. Your classic counter is the performance monitor, processor time.
Performance Counters | Critical Value |
| Object Processor | |
| (_Total)\% Processor Time | 80% for 5+ mins |
| Object Process | |
| (STORE.EXE)\% Processor Time | 75% for 5+ mins |
| (system)\% Processor Time | 75% for 5+ mins |
| (inetinfo)\% Processor Time | 75% for 5+ mins |
Note: If you have multiple processors, then multiply the critical value by the number of processors, for example, a critical value for a twin processor would be 160% for (_Total)\% Processor Time (80% x 2).
Guy Recommends SolarWinds’ Free Network Monitor
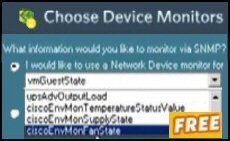
Thus utility makes it easy to check the health of a router or firewall. Check the real-time performance, and availability statistics, for any device on your network. Get started with an extensive collection of "out-of-the-box" monitors for popular network devices. Give Network Monitor a whirl – it’s free. Download your free Network Device Monitor
If you need more comprehensive network analysis software:
Download a free trial of NPM (Network Performance Monitor)
Summary – Monitoring Processor
Processor bottlenecks are the easiest to problem detect in Exchange 2003 server. Monitor % processor time, and just look for a trace which looks like a curtain hanging from a ceiling. You gain extra information by logging process counters, for example store.exe.
Download your Exchange 2003 Disaster Recovery and Troubleshooting eBook for only $9.95
 The extra features you get in your eBook include: ‘How to…’ sections with screen shots. Checklists to prepare your migration plan.
Lots of tips, recommendations and troubleshooting advice. Printer friendly pages in both PDF and Word format.