Performance MonitoringWindows Performance Monitor (Perfmon) is a tool that everyone flirts with but few master. My aim this week is to spur you to give this troubleshooting technique a fresh look or another chance. There are four reasons to use performance monitor. 1) Troubleshooting a Bottleneck.
2) Routine Server Health Check
3) Capacity Planning.
4) Learning more about server components. For example Memory and Disk. The benefits of Perfmon are that you increase your network’s efficiency while you learn more about what is going on under the surface. Officially, the goals of performance monitoring are to detect bottlenecks and capacity planning. Unofficially, performance monitoring is all about having fun while you learn more about computer memory, processor disk and network components. Guy Recommends: Tools4ever’s UMRA Tired of writing scripts? The User Management Resource Administrator solution by Tools4ever offers an alternative to time-consuming manual processes. It features 100% auto provisioning, Helpdesk Delegation, Connectors to more than 130 systems/applications, Workflow Management, Self Service and many other benefits. Click on the link for more information onUMRA. The most likely finding of charting your servers performance is that at least one machine needs more RAM. When I visit companies and carry out a network health check, I like to justify my modest fees by saving the company money. My agenda is looking for cost nothing solutions such as moving services from servers with a high workload to those who are are just ticking over. My speciality is finding servers that the computer department did not know existed, or had forgotten about. Performance Monitoring is part science, part art, but mainly experience. Beginners fixate on one idea, old hands keep an open mind. Therefore beginners monitor one counter for half an hour. Whereas old hands always monitor the big four objects Memory, Processor, Disk and Network. Moreover experienced practitioners are likely to set Perfmon running go away for a few hours then return and analyse the traces. The art of performance monitoring is a bit like playing quarterback, your first read is your number one speed receiver (Memory), then it’s the guy in the slot (Processor), then the tight-end (Disk) finally if all receivers are covered check down to the running back (Network).
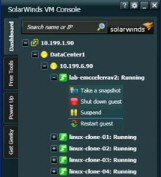
Lots of useful computer services• Solarwinds Orion NPM Review • How to Shut Down Win8 •Win8 Eventlog • Win8 FAQ • Ezines • E 167 WinDiff •E 131 BigInfo •E 123 WinDiff • E 102 SysPrep •E 69 Perfmon •E62 WinDiff • E 25 Event Trigger • E 24 CacheMov • E 18 Services •E 16 Perfmon • Exchange Monitor |