Windows Server Performance Monitor – Memory
 Introduction to Memory Bottlenecks If ever your Windows 2003 server is running slowly, then the first place to look for a bottleneck is memory. Another way of looking at server performance, is that machines with plenty of RAM rarely give problems. A bonus of plenty of memory is, that to …
 Review of SolarWinds APM SolarWinds’ APM (Application Performance Monitor) is particularly useful for inspecting the services and processes on servers such as SQL or Exchange. Try the updated SAM (Server & Application Monitor) Topics for SolarWinds APM Reasons for Experimenting With SolarWinds APM System Requirements for APM Decide Your Initial …
 Review of SolarWinds Orion NPM v10.2 Orion Network Performance Monitor (NPM) is what I call the ‘big tackle’. Big in its power to zoom into network trouble spots, and big in the comprehensive range of checks that it manages. If you are reviewing performance monitors, then download a free trial …
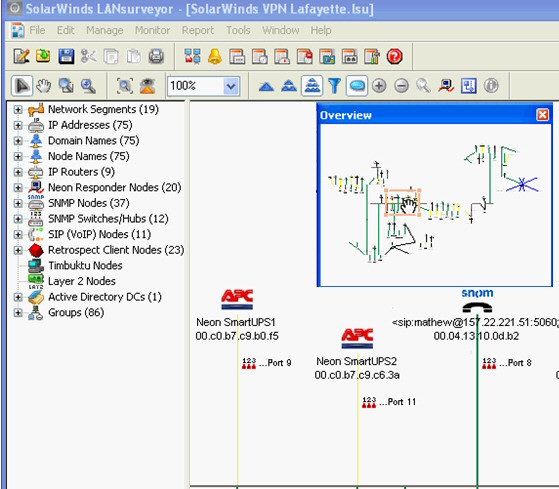 Review of LanSurveyor As its name suggests, LAN Surveyor automatically maps devices on your network. It works by discovering computers and other devices on your network, and then producing comprehensive, easy-to-view diagrams that you can export into Microsoft Visio. Try LanSurveyor now, and get an up-to-date network map in just …
 Problems Making Phone Appointments at the Doctors’ Surgery Doctors’ Phone Service – Guy’s B�te Noire I say again, doctors are the only profession that exceed my expectation. At the other extreme, phone systems consistently disappoint me. This is because I can remember the halcyon days when if you phoned the …