Vista Data Collector Set 

Creating a Data Collection Set is Vista’s way of Performance monitoring. While we have a huge amount of control over to what to record, Microsoft helps us by providing built-in templates.
Topics for Vista Data Collector Sets
- Why Use Data Collector Sets?
- Vista Data Collector Sets in Action
- Windows 7 Data Collector Set
- The Art of Performance Monitoring
- Creating a Data Collector Set
- Data Collector Set Reports
- Case Studies for Performance Monitoring
- Secret Remote Data Collector Technique
♦
Why Use Data Collector Sets?
In a nutshell you use the Vista Data Collector Sets when you have a performance or a connectivity problem. This is an ideal technique to diagnose problems not only on Vista desktop machines, but also on Server 2008.
If a computer is responding slowly, then create a performance collector set to see if the root cause is due to a CPU, RAM or a disk problem. If you suspect a disk is about to fail, or have a driver problem then run a diagnostic test. Remember to look in the Reports folders to see the results of you Data Collector Set.
Perfmon or Resmon?
Let us take a timeout to check that you have the correct program. If you are at a Windows 7 computer click on the Start orb, launch first perfmon, then resmon. My point is that I wanted to check that you were looking for the Windows 7 Performance Monitor, and not the Resource Monitor.
Vista Data Collector Sets in Action
What a Data Collector Set does is capture multiple statistics and save them into a permanent record. Furthermore, the Performance Monitor provides a tailor-made report structure so that we can review these logs.
Sets can contain readings from Performance counters, Event trace data, System configuration information and even registry values. These Sets also combine the old Alert feature of Performance Monitor. All you need to do is experiment with different thresholds and rules for scheduling data collection. Another useful troubleshooting tactic is to run WMI (Windows Management Interface) tasks after the Data Collector finishes.
The Art of Performance Monitoring
If a server, or even a desktop machine, is running slowly, then you need to find the bottleneck. You could run through the progression of a quick look in the task manager, an initial check of the Performance Monitor in real time, and finally create a Data Collection Set.
There is a bewildering choice of performance counters, and you can save a lot of time by accepting the wizard’s suggestion to use the big four keywords (counters): CPU, Memory, Disk and Network. The next decision is do you manually right-click and ‘Start’ collecting, or do you configure the Schedule tab in the Data Set’s properties.
Once the set has finished collecting the data, navigate to the Reports sub-folder. (You can either right-click and manually stop, or just wait for the end of the scheduled collection.) As someone who started with perfmon in NT 3.51, I cannot emphasise enough how much easier the Reports make it to interpret the data. At each stage the menu headings, give you a hint of whether the statistics are normal or indicate a bottleneck. Furthermore, you can drill down for extra details.
Guy Recommends : SolarWinds’ Free VM Monitor

The best feature of this new this new version of SolarWinds VM Monitor is that it checks Windows Hyper-V. Naturally, it still works with virtual machines on VMware ESX Servers. VM Monitor is a clever desktop tool that not only tests that your server is online, but also displays the CPU and memory utilization for each node.
It’s easy to install and to configure this virtual machine monitor, all you need the host server’s IP address or hostname and the logon info. Give this virtual machine monitor a try – it’s free.
Download your free copy of SolarWinds VM Monitor.
Creating a Data Collector Set
Thanks to the wizards, and their structured menus, it’s easy to get started with Data Collector Set. My advice is to have a quick run through to see what’s going to record and then create a second set making more thoughtful choices of items. 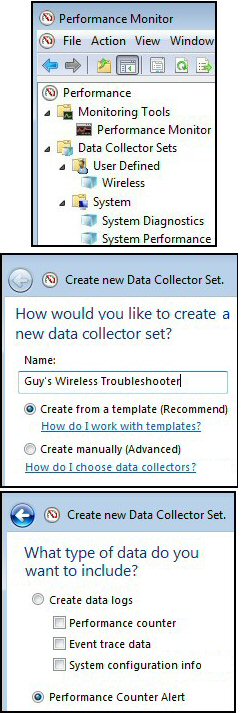
- Assumption: The Performance Monitor is running. (Click on the Start Orb, type Perfmon.)
- Our mission is to create a Data Collector Set, which monitors Performance counters.
- Expand the Data Collector Sets folder.
- Decide if you want User Defined System Diagnostics or System Performance.
- Assuming you want a User Defined Set, right-click select New point to New, and click Data Collector Set.
- Give a name to your Data Collector Set. (Guy’s Wireless Troubleshooter in screenshot)
- Let us select the Create manually option. [Click Next].
- Select the Performance Counter Alert option. [Click Next].
- Now you are ready to Add Counters. Make your choices. [Click Ok]
- Define alerts based on the values of performance counters you have selected.
- From the list of Performance counters, select the counter to monitor and trigger an alert.
- From the Alert when drop-down, choose whether to alert when the performance counter value is above or below the limit.
- In the Limit box, enter the threshold value.
- When you are finished defining alerts, click Next to continue configuration or Finish to exit and save the current configuration.
- After clicking Next, you can configure the Data Collector Set to run as a particular user. Click the Change button to enter the user name and password for a different user than the default listed.
- Note: The minimum credentials you need are those of a member of the Performance Log Users group, naturally, an Administrator’s credentials will also work.
- Click Finish this will return you to Windows Performance Monitor.
- I often check the properties of the Data Collector Set and fine-tune my choices.
- Mostly, especially when I am learning or testing, I decide to start the Data Collector Set immediately.
- Alternatively, you can exit without starting the collection set. [Save and close.]
Find Your Results
Once you have collected your data, then head for the ‘Reports folder and work thought the structured menus to find resources that are in short supply.
The great thing is that you can delete experiments that did not work out, and with each new Data Collector Set you get more proficient at Performance Monitoring and diagnosing the root cause of a problem.
Data Collector Set Reports
Lower down in the Performance Monitor interface is a Reports section, this is where to find the result of your earlier work in creating a Data Collection Set. A reminder that there are two distinct roles, firstly performance monitoring for bottlenecks (e.g. CPU memory), secondly diagnosing faults such as driver or disk.
Tip: When you are in troubleshooting mode you can run this command (note the singular report):
perfmon /report
What this does is run the System Diagnostics for 60 seconds and then you see a report to help you track down problems on your Vista machine.

Case Studies for Performance Monitoring
Here are possible sources of bottlenecks, which data collector sets draw to your attention.
- A program monopolizes a particular resource. E.g. Malware hogs the CPU.
- Insufficient resources are available. E.g. a database programe consumes most of the memory.
- A program, device, or service fails. E.g. the scanner times-out.
- Software is incorrectly installed or configured. E.g. missing DLL or wrong version of a driver.
- The system is incorrectly configured for the workload. E.g. not enough memory is a common problem.
Solutions to Performance Problems
It helps problem solving if you review the range of solution at regular stages. At one extreme you could buy new faster hardware, or complete system. Yet at the other extreme, a cost nothing solution such as load balancing could fix the problem at least temporarily.
If you say to yourself, OK, I’ll splash out and by a new system. Your brain may say, ‘but there is nothing wrong with the disk subsystem’, followed by, ‘Hang on, those quad-processors are already overkill’. Then a better solution emerges, ‘How about if I just add more memory?’
However, an alternative thought process could be, ‘Let’s just by new memory, hmmm… than means that single processor will be the bottleneck. And 80GB disks looked big 5 years ago, but they are full and these days we can get much bigger disks for the price we paid. Also, isn’t that fan a bit noisy? Conclusion, why don’t we buy a balanced system with new components.’
Guy Recommends: A Free Trial of the Network Performance Monitor (NPM) v11.5
v11.5
SolarWinds’ Orion performance monitor will help you discover what’s happening on your network. This utility will also guide you through troubleshooting; the dashboard will indicate whether the root cause is a broken link, faulty equipment or resource overload.
What I like best is the way NPM suggests solutions to network problems. Its also has the ability to monitor the health of individual VMware virtual machines. If you are interested in troubleshooting, and creating network maps, then I recommend that you try NPM now.
Download a free trial of Solarwinds’ Network Performance Monitor
Specific Advice
- Add more resource, e.g. buy another memory SIMM / DIMM stick.
- Load-balancing, move some of the processes, or users files, to another disk.
- Upgrade, buy a faster disk system.
- Baselines, creating baselines separates the professionals from the amateurs. It’s just so much easier to solve a problem that arose this week if you know what ‘Normal’ looked like. When you have baselines from last week, last month and last weekend, then the patterns provide the clues for a speedy resolution.
Secret Remote Data Collector Technique

The simplest, and most useful technique is to use Vista to capture data from servers. This removes the accusation of bias that people always bring up when you collect data from the machine where performance monitor is running. Another reason for using a Vista laptop to collect data remotely is that it may be more convenient then working in that noisy server room.
When the wizard asks which performance counters would you like to collect? You click on the Browse button and select the network computers that you wish to monitor. Naturally, you must select the counters for your project.
Summary of Vista Data Collector Set
There are two related reasons to create a Data Collector Set, firstly, to diagnose a fault urgently, and secondly, to collect performance data on your CPU, memory and disk so that you can detect the bottleneck. For those with previous knowledge of perfmon they will be impressed with Window’s 7 structured approach to collecting and analyzing statistics about the operating system.
If you like this page then please share it with your friends
Configuring Windows Vista Topics:
| Vista Tools and Extras |
Download Your Tweak the Registry Ebook for only $6.45 This ebook will explain the workings of the registry. I thoroughly enjoy tweaking the registry, and I want to distill the best of my experiences and pass them on to you. Each registry tweak has two aims; to solve a specific problem, and to provide general learning points, which help you to master regedit. Over 60 pages ebook and PDF format
| |
