Administrators worth their salt know that network monitoring is the key to maintaining an enterprise grade network. Monitoring your usage data from the perspective of a LAN monitoring tool is Network Maintenance 101. The reason is that it is nearly impossible to ensure the integrity of systems that you can’t see. If you’re maintaining a network based on gut feelings alone, you’re bound to run into trouble.
A LAN monitoring tool helps users to keep track of their network health, service status, and device utilization. In short, they help to ensure that all equipment is up and running. Many problems that networks run into that cause downtime are completely preventable. Taking the time to analyse your network and address problems in their infancy reduces the risk of key systems going down. In this article we look at the best LAN monitoring tools for your enterprise.
Key Differentiators of LAN Monitors
It comes as no surprise that not all LAN monitors are built the same, some offer a lot and some offer a little. We’ve prioritised products by a list of key differentiators that are useful to the user. These include:
Virtualization – This allows you to view the health of your network through a graph or other visual display. This makes your monitoring activity much easier.
Alerts – Large networks have hundreds (or thousands!) of unique processes that need to be monitored each day. Having active alerts makes sure that nothing slips through the net.
Customizable Dashboard – A customizable dashboard is important because it allows you to create a monitoring environment that is designed around your requirements.
Here is our list of the best LAN monitoring tools:
- SolarWinds Network Performance Monitor (FREE TRIAL)
- Paessler PRTG (FREE TRIAL)
- ManageEngine OpManager
- Nagios XI
- Zabbix
- ConnectWise Automate
- Ipswitch WhatsUp Gold
1. SolarWinds Network Performance Monitor (FREE TRIAL)
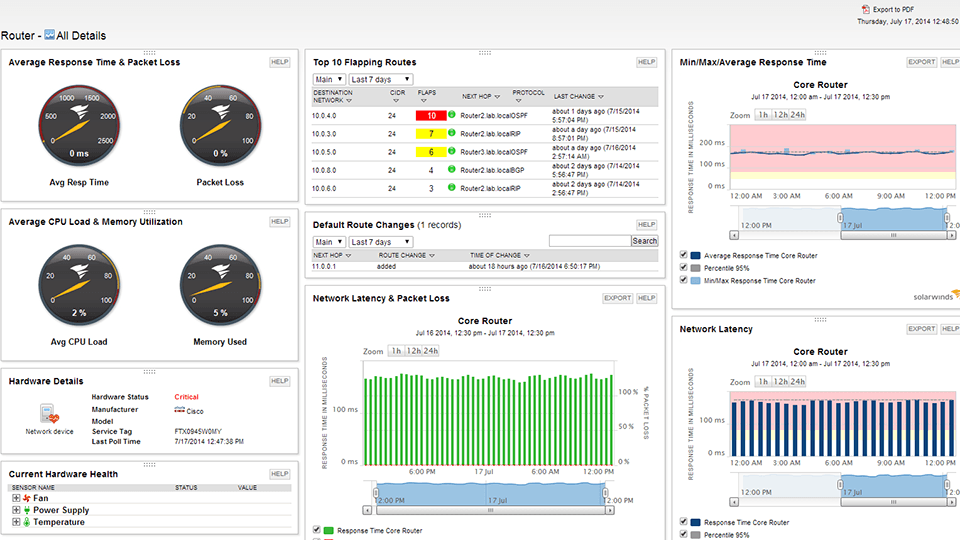
SolarWinds Network Performance Monitor has developed a lot of traction among administrators as an excellent LAN monitoring product. This product allows the user to conduct in depth LAN monitoring. The LAN monitoring all takes place through the dashboard which provides an overhead perspective of the network’s infrastructure health. On the dashboard you can view graphs and pie charts identifying the status of your physical infrastructure.
For example, if a service is up and running without complications, it will be denoted as green. However if there is a problem occuring the service is shown by the color yellow. In the event that an application or device is in a critical state it will be flagged by the color red. It only takes a few seconds to see if your network is incurring difficulties.
This is just the tip of the iceberg in terms of SolarWinds Network Performance Monitor’s capabilities. With the alerts system you don’t need to catch everything happening live manually. There is a dedicated alerts view that shows you all of your active alerts based on their time being active and the time they were triggered. You are also provided with a brief description of the fault at hand.
For example, you’ll receive a notification if an application has a high response time. This allows you to cut down your monitoring activity to the bare minimum. You don’t need to drill down through multiple infrastructure views; you can simply run your monitoring activity through the alerts window.
Overall, SolarWinds Network Performance Monitor is an excellent addition to any LAN monitoring environment. SolarWinds Network Performance Monitor is available for a price of $2,955 (£2,232). We recommend this product to organizations looking for a fully-featured but lightweight monitoring suite. If you’d like to try out SolarWinds Network Performance Monitor you can download the 30-day free trial from this link here this link here.
2. Paessler PRTG (FREE TRIAL)
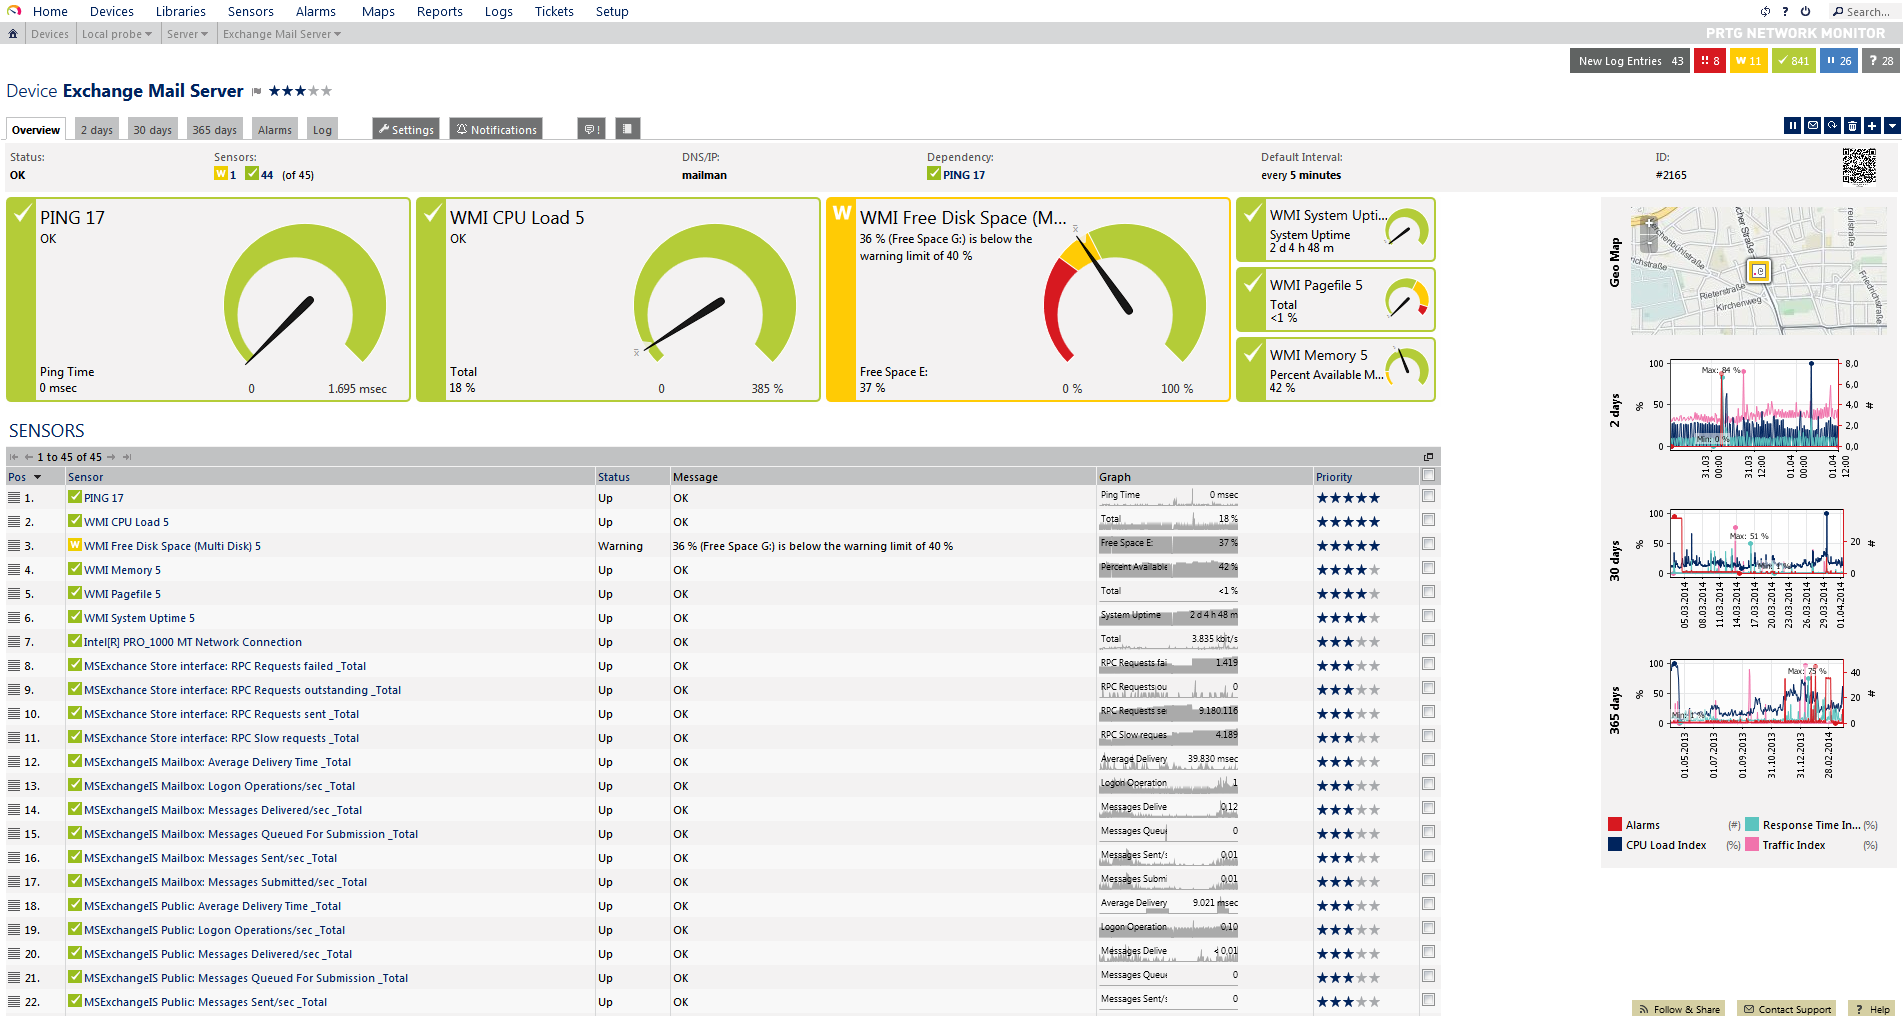
Paessler PRTG is one of the most competitively-priced network monitoring products on the market. PRTG has a freeware version that allows you to monitor up to 100 sensors at no charge. With PRTG users can scan their network through IP ranges. While this doesn’t have the same efficiency as SolarWinds Network Performance Monitor’s autodiscovery feature, it still eliminates much of the manual configuration that would be needed without it.
The alerts system is something that PRTG also does very well. You can receive status alerts when a device is failing or experiencing a fault. You can configure PRTG to send you alerts to an email or SMS device if there is a problem. This is great for allowing you to monitor from a distance. There are also PRTG apps for Android, iOS and Windows which will send push notifications straight to your phone.
PRTG’s visualization is one of the reasons why it has become such a popular product. The dashboard design is completely customizable, and you can deploy everything from status lights to network maps. You can also display your information in the form of graphs, charts and dials depending on your need. While it can be a little trickier to take in all of this information than other top of the range products, it is still one of PRTG’s greatest assets.
While the freeware version of PRTG is good for smaller organizations, larger organizations will need to pay extra for more sensors. The paid version starts at $1600 (£1,208) for 500 sensors, which increases to $2850 (£2,152) for 1000 sensors. If you need more you can purchase 2500 sensors for $5950 (£4,494) or 5000 sensors for $10500 (£7,930). Even larger enterprises can purchase XL1 Unlimited for an unlimited number of sensors for $14500 (£10,951). If you’d like to try out the free trial or freeware version of PRTG, then click this link here.
3. ManageEngine OpManager

If you’re familiar with the network monitoring space then ManageEngine OpManager is a name you’ve probably heard of before. ManageEngine OpManager utilizes SNMP polling to verify the status of devices and applications throughout your network. SNMP polling is used to generate a response from your connected infrastructure to see how quickly a service responds to assess how well it is functioning.
ManageEngine OpManager’s SNMP polling is also used to provide an autodiscovery function. ManageEngine OpManager can poll devices and add them to its monitoring environment automatically. You are then provided with a map that gives you a visual display of your entire network. Overall this is a very useful feature as it allows you to monitor your network from a visual perspective.
ManageEngine OpManager is a great product because it allows an administrator to juggle many different monitoring tasks. In addition to the basic network monitoring, there is also the ability to monitor NetFlow traffic. NetFlow traffic analysis allows you to see how much of your bandwidth is being used up by applications and devices throughout your network. Traffic analysis is a useful addition because it allows you to exercise true Quality of Service (QoS) monitoring.
One of the advantages that ManageEngine OpManager brings to the table is that it can be used on both Windows and Linux. This makes it suitable for organizations looking for a multi-OS product which can function with a diverse range of products. ManageEngine OpManager operates a flexible pricing structure which makes it ideal for organizations looking to enshrine scalability at the heart of their monitoring activity.
There are three versions available of ManageEngine OpManager; Essential, OpManager Plus and Enterprise. The Essential edition can be purchased for a price of $595 (£449) which covers 25 devices. OpManager Plus can be purchased for $995 (£751) covering 25 devices. If you need more bandwidth then you can purchase the Enterprise edition to cover a whopping 500 devices for $16,495 (£12,460). There is also a free version where you can manage up to 10 devices.
4. Nagios XI

Nagios XI is a LAN monitoring product that runs through a web-based GUI. Not only is the Nagios XI platform easy to deploy because of this, but it is also very convenient to use. With this product your network usage data is sent straight on the dashboard. On the dashboard you can see summaries of your devices detailing whether a device is up and running or not. One particularly useful view is the Top Alert Producers Last 24 Hours view which allows you to highlight the most pressing issues to address on your network. This is beneficial for administrators attempting to prioritize their response to network issues.
Nagios XI is an open source product and is user friendly. This is shown through the platform’s array of configuration wizards which take you through the process of setting up individual features and functions. For example there are autodiscovery and DNS query configuration wizards that step you through the setup process. The real advantage here is that you can get all of the features out of Nagios XI without having to rely on guesswork.
It is important to note that you can also expand Nagios XI’s architecture through the use of APIs. APIs can be used to combine Nagios XI with external add-ons to add new features. There are over a thousand add-ons which can be used to bolster your monitoring ability.
Nagios XI is a flexible platform that is well worth considering whether you are an SME or a large organization. The Standard Edition starts from a price of $1,995 (£1,506) which includes configuration wizards, reporting, custom user dashboards and notification escalations. The Enterprise Edition is available for $3,495 (£2,639) and also includes capacity planning reports, scheduled reports and notification deployment. There is also a 60-day free trial which can be downloaded here for Windows, Linux and VMware.
5. Zabbix
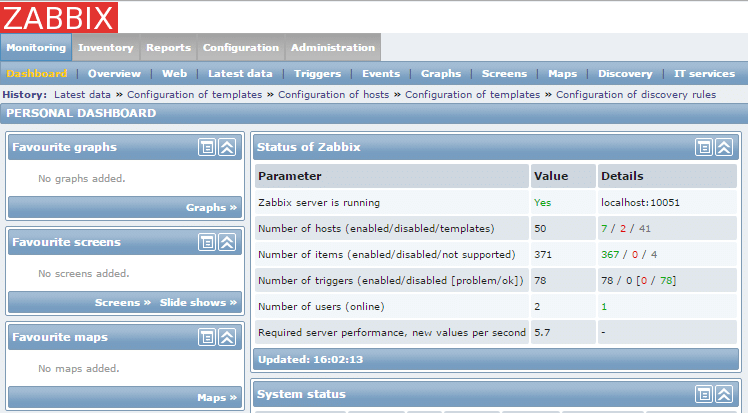
With over 20 years of experience in the game, Zabbix is a network monitoring provider that knows a thing or two about LAN monitoring. Zabbix is an open source LAN monitoring platform that allows users to monitor their network for free. This product uses SNMP polling to verify the status of devices throughout your network to tell what is going on in real time. Whether you need to monitor devices, applications, cloud services or servers, Zabbix has you covered.
Zabbix isn’t a one-trick pony when it comes to network monitoring either. With this program you can monitor network bandwidth usage and packet loss rate to assess your connection rate. This means that you have a true 360 degree perspective of how effectively your network is functioning. The bulk of your monitoring activity takes place by looking at network health.
This is convenient given that network health is an area where Zabbix delivers a first class monitoring experience. You can monitor the basics from if a device is up to whether the device is running low on disk space or is simply too hot. In the event that a new device is added to your network, Zabbix will discover it automatically. The result is a fast monitoring environment which can keep pace with even the largest corporate network.
There are also a range of notifications that you can use to make sure that you keep up-to-date with what is happening on your network. You can receive notifications through email, SMS, Messenger or Jabber. If that is not enough you can go a step further by customizing messages to provide specific information to other members of staff.
Zabbix is one of the most competitive products on the market right now because it provides full-featured network monitoring yet it is free. Zabbix is available on CentOS, Debian, Oracle Linux, Red Hat Enterprise Linux, and Ubuntu. If you’d like to download Zabbix then you can do so from this link here.
6. ConnectWise Automate

ConnectWise Automate is a LAN monitoring tool that is often forgotten in the competitive world of network monitoring. However for organizations looking for a cloud-driven network monitoring platform it is hard to beat. One of the main features that sets ConnectWise Automate apart from the competition is its automation. There are over 400 scripts included with the product which can be used to conduct network maintenance automatically. For example you can automate and schedule future patches. This gets new users off on a good foot and reduces manual configuration.
That being said the user interface does seem a little out of date when compared to other platforms on this list. While it’s not bad, it doesn’t have the state of the art feel that a product like ManageEngine OpManager has. Nonetheless the dashboard provides you with information on how well your network is functioning. For instance you can view whether patches have been successful or whether they have failed.
ConnectWise Automate also has its own discovery system that discovers devices on your network. Overall this is a product that suits those who want to minimize their manual administrative activity. However in order to view a price quote you’ll need to contact the company directly. If you’d like to try out ConnectWise Automate you can do so from this link here.
7. Ipswitch WhatsUp Gold
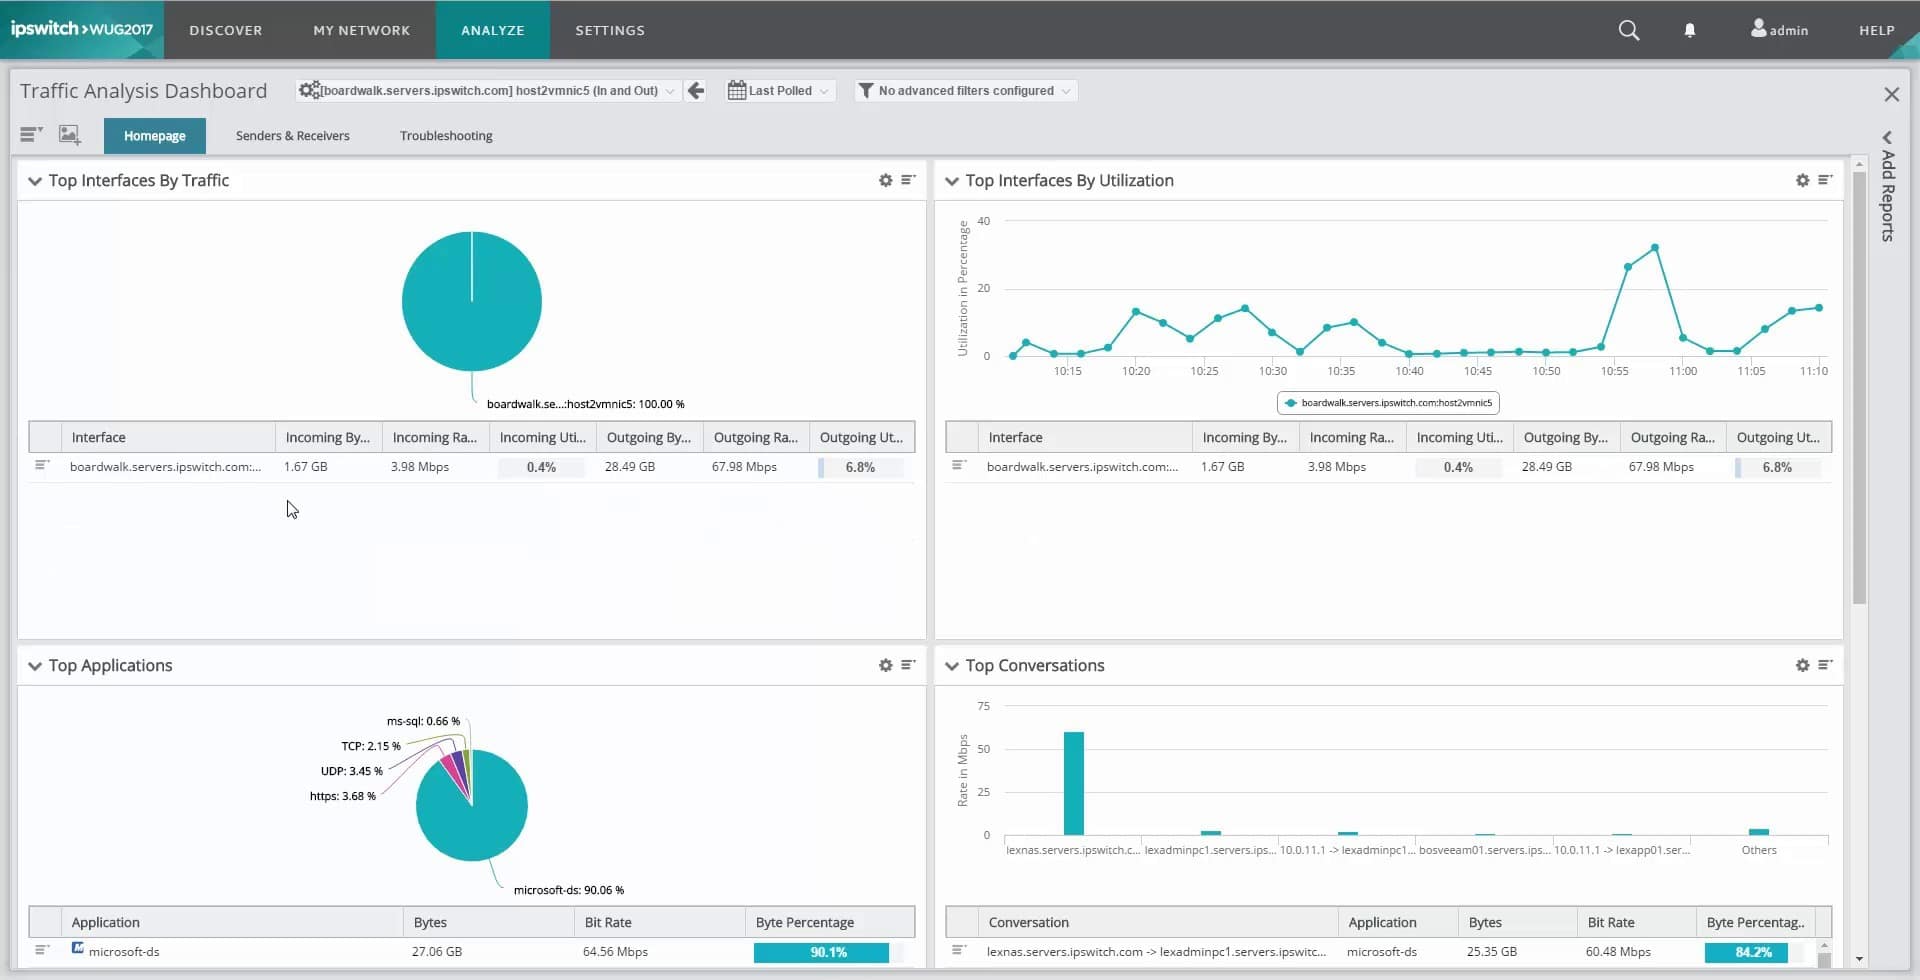
Ipswitch WhatsUp Gold is a network monitoring tool that doesn’t waste any time in letting you monitor your network. From the moment you launch WhatsUp Gold you can start automatically discovering devices throughout your network. This eliminates a considerable amount of configuration time that is usually spent manually adding devices on other products. As soon as your infrastructure has been classified, you can start monitoring your network.
Ipswitch has embraced a simple design with WhatsUp Gold which makes it easy to monitor the health of your infrastructure. Like SolarWinds Network Performance Monitor the performance of network infrastructure is divided up into colors. There are many different forms of visualization that WhatsUp Gold uses to relay this information. The core one you rely on will be the alert center dashboard.
As the name suggests, the alert center acts as a hub of all alerts and notifications about your network infrastructure. Here you are notified if a piece of equipment is experiencing difficulties. However, if you want an even more visual experience you can view your network as a topology map and view color-coded devices there. This makes it easy to see if specific clusters of devices are experiencing difficulties.
WhatsUp Gold is a great choice in terms of customization as well. The dashboard is customizable so that you can create unique dashboards for specific users. You can have views with activity logs, alerts, applications, servers and network traffic. This provides the user with enough depth to conduct thorough monitoring activity. There are many different pricing options available for WhatsUp Gold with packages available as an annual subscription or a license (though you’ll have to request a quote to see the cost for your enterprise).
The Premium version offers network device and server monitoring, automatic discovery, interactive map, availability and performance monitoring, alerts and notifications, customizable dashboards and reporting, wireless network monitoring and cloud storage monitoring. There is also a free trial which you can access through this link here.
The Best LAN Monitoring Tool: Solarwinds Network Performance Monitor
The best LAN monitoring tool depends largely on your aims, but we find SolarWinds Network Performance Monitor and WhatsUp Gold to offer the slickest overall monitoring experience. SolarWinds Network Performance Monitor delivers autodiscovery and a lightweight monitoring design that makes viewing your network very satisfying and simple. Likewise WhatsUp Gold offers its own premium autodiscovery feature and infrastructure health indicators that are easy to use.
However, if you’re more interested in a solution that enshrines security, then an open source solution like Nagios XI is one you should definitely consider. Open source applications are generally harder for hackers to access than closed source systems. The great thing about products like Nagios XI is that you can enjoy the security of open source platforms without sacrificing a premium user interface experience.
It is advisable to search around before committing to a single product. Whether that’s by trying out free trials or downloading the freeware version of a product like PRTG, it can help you to see how well you connect with a program before making a purchase. The most important thing to remember is that not all enterprises are built the same, so what is right for another company may not be right for you.