Application Performance Optimization Pack
If you need to manage your server, database or application's performance, then look no further than this integrated package. Thanks to SolarWinds' proven components (DPA and SAM), you get a complete view of uptime, capacity, and resource utilization across the full application stack.
The main benefit of of monitoring application and database performance is that you can speed-up problem solving across systems. Furthermore, optimizing the various components will also help to prevent bottlenecks.
Topics for SolarWinds Application Performance Optimization Pack
- SolarWinds Database Performance Analyzer (DPA)
- SolarWinds Server and Application Monitor (SAM)
- Mini Case Study – Slow Web Server
- SolarWinds Optimization Pack Video
![]()
SolarWinds Database Performance Analyzer (DPA)
Analyzing data response time is the key to better end-user satisfaction. First, select wait-based analysis to check connections; then employ response-time analysis to investigate the root cause of any tardy reply to a query.
The DPA also provides historic analysis and dynamic baselines, both of which are useful for recognising database tuning problems, and thanks to the agent-less architecture the load on the server is minimal.
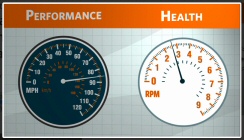
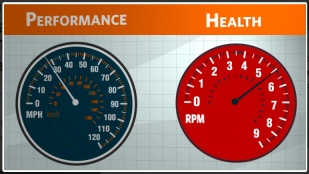
Using the analogy of a car's dashboard, the database's performance is like the speedometer, whereas the server's health is like the rev counter. The point is that the two dials don't necessarily move in synchrony, and our mission is to stop the health counter revving into the red.
SolarWinds Server and Application Monitor (SAM)
The SAM dashboard provides detailed application monitoring for CPU, memory, and disk capacity. You get built-in support for 200+ applications, whether they are on-premises or in the cloud. All the tools for troubleshooting are contained in linked set of interfaces, and the drill-down's and navigation are intuitive. After a few weeks of looking and testing you may well decide to investigate capacity planning. See much more about SolarWinds SAM.
Mini Case Study – Slow Web Server
In this troubleshooting plan we will monitor what happens from when the web application issues a query, until the database displays the results. For this we are going to integrate two SolarWinds products, Database Performance Analyzer (DPA) and Server Application Monitor (SAM).
Specifically, we are going to query the response time of database called MSSQLSERVER, on a server called Lab-Dem-SQL-02. The first point of interest is at the top of the screenshot, see where we get health check instances of: WAIT, QUERY, CPU, MEM, DISK, and SESS. Observe that we have a problem(!) with WAIT, QUERY and MEM.

By hovering over the chart you get a break-down of the wait times, and thus can deduce what is causing the bottleneck, for example WRITELOG.
Detailed Analysis of a Database Instance
In this follow-up example we are going to breakdown the database's response time. Observe the 5 tabs at the top of the SolarWinds interface, SQL Waits, Applications, Databases, Nodes and DB Users.

I have selected the 'Waits' tab because it often shows resource contention, which could occur if your database supports both SharePoint and Apache. SolarWinds provides an informational (i) link so that even novices can become an experts on Wait times.
For example: were you to click on (i) you would see a description of PageIOLatch_SH, and could read the explanation of how it is used for disk-to-memory transfers.
The information also suggests a solution: Ask developers to eliminate inefficient SQL statements.
SolarWinds Application Performance Optimization Pack Video
See how to get started with the Database Performance Analyzer (DPA).
![]()
Hardware Monitoring with SAM
SolarWinds’ SAM can also check the hardware health of well-known manufacturers. This is possible because SAM utilizes data from the vendors own software managers.
Examples of hardware health / status monitoring
- Hard drive
- Array, and Array controller
- Power supply, battery and voltage regulator
- Chassis fan speed and/or status
- Machine serial number
- CPU temperature fan speed
- Memory module status
You can also examine historical information, which helps to make a judgement if a reading is normal or requires investigation.
Extra Reasons for Experimenting SolarWinds SAM
Another reason for evaluating SolarWinds SAM is that you are curious to discover more about dependent services when the servers are running smoothly. SAM’s history is interesting because it takes a snapshot of the baseline before making changes.
From this research we get a better understanding of why a failure of one network or server component impacts others. For example, SAM will help us avoid amateur mistakes such as blaming the network for latency problems on a server.
Often the most frustrating problems are those that appear only sporadically. For these annoying intermittent challenges has an analyzer with retrospective network-analysis capabilities. This historical data enables you to quickly isolate and resolve the irregular network problem.
System Requirements for Your Application Performance Optimization Pack
Memory: Database Performance Analyser (DPA) – 4GB. Server Application Manager (SAM) 4GB.
Hard Drive: DPA – 3GB per monitored instance. SAM – 4GB.
Operating Systems:
DPA – Linux®/Unix® or Windows Server®
SAM – Windows Server® 2003 R2, 2008 R2, 2012, 2012 R2. Microsoft® IIS, version 6.5 and higher
Databases:
Oracle 10g, 11g, 12c (single tenant)
SQL Server 2008, 2012, 2014
Supported Instances:
- SQL Server® 2008, 2012, 2014
- Oracle® 10g, 11g, 12c (single tenant)
- SAP ASE (Sybase®) 15.0x, 15.6, 15.7, 16
- VMware® ESXi™ 4 and above
- DB2 LUW 9.x, 10.1, 10.5
Virtual Machines:
DPA – Java VM 1.6 or 1.7
SAM – .NET Framework v3.5 or 4.0
Web Console Browser:
Google® Chrome™ version 39 or higher
Microsoft Internet Explorer version 8 or higher with Active Scripting
Firefox® version 35 or higher (Toolset Integration is not supported on Firefox)
Summary: SolarWinds Application Performance Optimization Pack
This package from SolarWinds combines two proven software products, Database Performance Analyzer (DPA) and Server and Application Monitor (SAM). The plan is to use DPA to examine, wait time and response time, and employ SAM to study applications from the CPU, memory, and disk point-of-view.
![]()
More Free and Trial Network Software
Here are Guy’s evaluations, recommendations and download links for handy utilities.
• SolarWinds SAM Review • NPM Demo • NCM Review • Config Generator • LANsurveyor Review
• Free Network Traffic Analyzer • Review Kiwi Syslog Analyzer • Bandwidth Analyzer Pack
• SolarWinds Application Performance Pack � Network Engineers Toolset • SolarWinds WMI Tool