Review of SolarWinds NPM v12
NPM is designed for detecting network outages caused by broken links and faulty equipment.
Awesome is an overused word, but it describes the power that that SolarWinds agents and pollers give to this Network Performance Monitor.
Thanks to NPM v12, you really will get an answer to any question concerning the performance of your network devices.

Topics for SolarWinds NPM v12
Here are the key features of Solarwinds® NPM (Network Performance Monitor)
Network Availability and Performance Monitoring
NPM from Solarwinds provides comprehensive network availability and performance monitoring management to make sure that your network is running at optimal performance. The NPM's dashboard displays the performance all the nodes on your network. By using this web interface you can check what's occuring in real-time.
It's always instructive to examine the SNMP statistics from the routers, switches and servers; this data is particularly useful for detecting problems caused by slow traffic or packet loss.
- Monitor bandwidth utilization, packet loss, latency, errors, discards, and quality of service.
- Inspect disk space, CPU load, and memory usage on network devices.
- Hover over any network object to examine its status, IP address, machine type, and percent loss.
Hop-by-Hop Analysis along Critical Paths
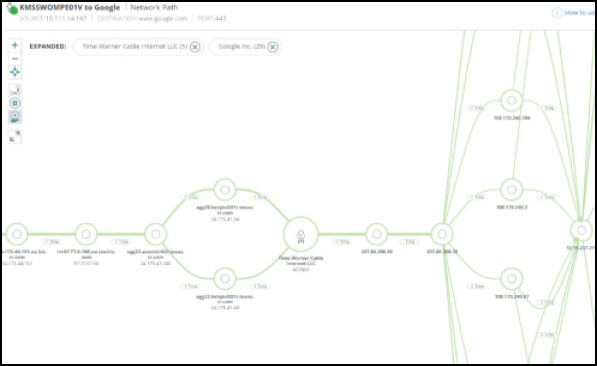
NetPath is a key reason to upgrade to NPM v12; it's better than TraceRT at detecting the network pathway from the source computer to the destination service.
What's most impressive, is the way NetPath not only shows you internet paths, but also measures the performance characteristics of each network node and link. You can even look inside the 'Cloud' and check the ISP's network. As a result it's easier than ever to spot bottlenecks.
Automated Device Discovery
Thanks to SolarWinds Sonar feature NPM automatically discovers any new server or router that is added to your network. You can also take advantage of the built-in Network Atlas™ to easily create or update network maps. Select from built-in map templates or better still, import an image of the network based on the building plan. SolarWinds has also integrated with OpenStreetMaps to allows you to drill-down from the world map to the device status. You can even utilize geolocation capability to automatically position devices on the map.
NPM 12 Configuration In Action

SolarWinds Network Insight and F5's BIG-IP®
Big-IP is a suite of products created by the F5® company. Its mission is accelerated data delivery; it covers all aspects of traffic management from web acceleration and load balancing to data distribution across SANs.
In NPM 12 SolarWinds introduce a new feature of their own, its called Network Insight. What this provides is comprehensive analysis even if the application service is spread across many LTMs, GTMs, or dozens of servers.
Intelligent Network Alerts
SolarWinds NPM enables you setup network alerts. By creating multiple conditions you can respond to any set of circumstances on your network. For instance, to help with capacity planning, you could create alerts on bandwidth memory usage and disk space.
Conditional Group Dependencies allow you to group connected devices, the benefit is users receive only a single critical alert if there is a problem with the core routers. As a result, users can distinguish between what's really down and what is merely unreachable.
The resulting alerts are delivered via any of the usual methods, email, paging, SNMP traps, text-to-speech, syslog messaging.
Wireless Heat Maps 
You supply the office floor plan, and NPM v12 will use triangulation of wireless points to record the strength of the signal in each room; you can see a display of the resulting heat map on the NPM console. The benefit of knowing where signal strength is low, is that you can reposition the wireless points to improve network coverage.
See a review of wireless heat maps.

Dynamic Statistical Network Baselines
SolarWinds NPM constantly calculates the performance baselines from historical data. The built-in Baseline Threshold Calculator automatically calculates Warning and Critical thresholds by referring to each workloads' baseline. Actually. there are four levels of threshold, good, warning, critical, and down. This helps you distinguish between a device that is performing poorly and a one that is likely to fail soon.
Enterprise Scalability
From small networks with less than 100 elements to large organizations with over 10,000 individul elements SolarWinds NPM ensures that your network will never outgrow the ablilty to poll and manage our hardware.
- SolarWinds Polling Engine. Investigate where it's worth adding more polling engines.
- SolarWinds Web Server Engine. Add another Web server so that more users can access the NPM Web portal without affecting performance.
- SolarWinds Failover Engine. This gives you the peace of mind of a two-minute failover for the SolarWinds management system.
SolarWinds Enterprise Operations Console. Shows you a unified picture of remote servers and their associated modules.
Quality of Experience and Deep Packet Inspection
What you need to know when troubleshooting is if the problem is caused by the application, or the network. Deep Packet Inspection and Quality of Experience give you the ability to identify changes in application performance and compare them with network metrics to determine if the fault lies on the network or is back at the application.
I love the Top 10 veiws you get with the Application Performance and Health Dashboard. Check the Top 10 tables and graphs, also drill-down into the application details. As with so many of SolarWinds features, you can customize the information displayed on the applications, so you see the data that you are most interested in monitoring.
Hardware Health Monitoring
SolarWinds NPM's hardware health monitoring enables users to monitor the state of key device sensors including temperature, fan speed, and power supply, naturally it can create alerts if the hardware crosses pre-defined thresholds. SolarWinds NPM's LUCID Web-based interface provides at-a-glance insight into the health of network hardware for quick detection of potential issues. Additionally, its built-in report writer creates customizable hardware health reports for distribution.
Drag-and-Discover Interactive Charts
SolarWinds NPM's drag-and-discover performance charts include a timeline chart that allows users to easily select a desired time frame. Alternatively, they can zoom for a one-hour, 12-hour, or 24-hour windows. From there, it's easy to mouse-over particular data points and get detailed performance statistics.
Remember, you can always get support on all aspects of NPM from SolarWinds’ experts starting with the Thwack forum.
System Requirements for SolarWinds NPM v12
- Operating Systems for Orion: Windows 2003, 2008 and 2012 Server, including R2 (32-bit or 64-bit).
Please note, that you also need to install IIS and .NET Framework 3.5 - Resources: CPU Speed: 3.0 GHz; Hard Drive Space: 30 GB; Memory: 4 GB
- Database: SQL Server 2005 SP1, or SQL Server 2008 (Express, Standard, or Enterprise)
Installing NPM v12
I am not the fastest installer and it took me 90 minutes to setup NPM, however, most experts take less than an hour to get started. How long will it take you to install NPM?
SolarWinds Network Performance Monitor Additional Benefits
Integrate with Microsoft Active Directory
Take advantage of your existing Microsoft Active Directory and permit selected users to log in to SolarWinds NPM. I like to enable AD pass-through login and thus bypass the login screens.
Incorporate Microsoft System Center Operations Manager (SCOM)
SolarWinds provide a free NPM Management Pack that enables integration with Microsoft System Center Operations Manager (SCOM) 2007 and Microsoft System Center Essentials 2007.
Monitor Mobile Views for iPhone®, Blackberry®, and Android™
Study network performance from mobile Web browsers such as iPhone, Blackberry, and Android.
Integration with other SolarWinds Management Solutions
NPM integrates with all network, server and application management solutions from SolarWinds, including Server & Application Monitor (SAM), Network Configuration Monitor (NCM), NetFlow Traffic Analyzer (NTA), and VoIP & Network Quality Manager (VNQM).
In case you are wondering, NPM also integrates with SolarWinds Virtualization Manager and also SolarWinds Web Help Desk to allow auto-population of network alerts into service desk tickets.
Log & Event Manager (LEM)
If you are looking for an application that can provide automatic reaction to events, then check-out another of SolarWinds’ apps namely the Log & Event Manager. In addition to analyzing logs from routers, anti-virus software and Windows logs on the servers, LEM can also help you achieve IT compliance. Review SolarWinds LEM
Value for Money in Performance Monitoring
It’s only fair to point out when reviewing SolarWinds performance monitors is that the full package represents a big investment. Indeed, there are cheaper performance monitoring packages, but they don’t have the data collection and storage capacity of SolarWinds NPM v12. Actually, my biggest discriminator in determining whether a product is cheap or expensive is the quality of the support staff. Some people say SolarWinds is expensive, but nobody complains about the troubleshooting skills of SolarWinds’s technical staff.
More good news is that SolarWinds offer of a trial version of NPM v12 so that you can see if this performance monitor really would save you money in the long run. Another way of reducing costs is to select only the NPM modules that you need. Once you see the benefits, particularly if you are trying to track multiple sites, then it's easy to justify adding more options later.
There are cheaper alternatives to each SolarWinds module, but one hidden benefit is that all the modules integrate with each other, which makes it so much easier for reporting and root cause analysis. Also most rival products don’t supply the level of detail that you get by drilling down through the network maps.
Summary: Review of SolarWinds Network Performance Monitor
SolarWinds could have designed Network Performance Monitor (NPM) to answer the question: 'Is this latency problem due to the network, or the application server?'
Actually, the NPM dashboard displays so much more; thanks to a comprehensive range of pollers and agents you can zoom-in to the computer network trouble spot and investigate the underlying problem.
See Also: SolarWinds Server Health Monitor
Server Health Monitor is another free tool from SolarWinds. It is a chopped-down version of NPT, which shows you the performance of server components such as power supply, temperature, battery and fan speed. See more on Server Health Monitor
Full Reviews of the SolarWinds Licensed Family of Applications
Here are Guy’s comprehensive evaluations, comments and recommendations for SolarWinds licensed products. Each application offers a 30 day trial of a fully functional program, so check out the download links provided.
• Review of SolarWinds NPM • SolarWinds SAM Review (Apps) • AppInsight for Exchange
• SolarWinds NCM (Configuration) • Web Performance Monitor • Performance Monitor
• User Device Tracker • Application Monitor • Orion SLA Monitor • SolarWinds IPAM 4 • Home