Introduction to Network Bottlenecks
Running programs over the network is likely to result in network bottlenecks. Other causes of high network activity are, roaming profiles, file copying or large print jobs. Use performance monitor to create a log and calculate the network utilization.
Network Topics
- Key Network Counters
- Detecting a Network Bottleneck
- Problem with Network Segment / Network Utilization
- Overview of Microsoft Network Monitor 3.2
- Response Time Viewer
- A Vision of Network Monitoring
- NetFlow Network Monitoring
- Solutions to Network Problems
♦
Key Network Counters
Begin by selecting these counters:
Network Interface\ Bytes Total/sec
Network Interface\ Bytes Sent/sec
Network Interface\ Bytes Received/sec
Network Interface\ Current Bandwidth
Detecting a Network Bottleneck
Before you launch in detecting network bottlenecks, it’s worth checking, and eliminating, hardware problems with the NIC, or a broken cable. If you are not sure have a look at the device manager or even the system logs. Any doubts, try changing the network card and the cable, especially if this is an intermittent problem. Counters that may confirm a hardware problem are: Packets Outbound Errors and Packets Received Errors counters
This network example assumes that your hardware is working properly. There are several cautionary tales with the performance monitor chart below. Let me see if I can convince you that the maths prove a network bottleneck.
The Bytes / Sec average 913,999. Beware, System Monitor never uses thousand separators which make the figures awkward to read. I have often revisited the data because I was out by a factor of ten. For example, at a glance you could mis-read 913999 as approximately 91,399 or even 9,1399,999.

Diagram 1
You may think that just comparing the red line (Current Bandwidth) with the white line (Bytes /Sec) proves that the network is at full capacity. On closer inspection of the Scale, you realize that the red line is 10x bigger than the white line. Now you may revise you estimate and believe that the network is only running at 10% of capacity. However, there is one more factor, the red line is in bits while the white line is in bytes. 1 bytes = 8 bits. When you compute all these factors, the network is actually running at 73%.
Summary of Diagram 1
- White Line Bytes /Sec = 913,999 bytes x 8
- White Line Bytes /Sec = 7,311,992 bits.
- Red Line Current bandwidth = 10,000,000 bits
- Network Utilization = 73.12%
Background to Networks
One of the amazing features of the original ethernet network is that only one machine can transmit at a time. Once the network reaches 30% capacity, pure chance means that two machines try and send a packet at the same instant. The result is more and more collisions start happening, this leads to re-transmissions and a slow down of network traffic.
Networks bottlenecks occur at surprisingly low levels of utilization. 40% would normally be considered a bottleneck, and the only reason that I got a higher value was that there are only three machines on my test network. The more machines the greater the risk of collisions from two machines wanting to transmit at once.
However, with modern production networks two items of technology have alleviated the above bottleneck problem:
a) Switched networks replacing hubs
b) Faster network cards replacing the old 10MB cards.
Guy Recommends: A Free Trial of the Network Performance Monitor (NPM) v12
v12
SolarWinds’ Network Performance Monitor will help you discover what’s happening on your network. This utility will also guide you through troubleshooting; the dashboard will indicate whether the root cause is a broken link, faulty equipment or resource overload.
Perhaps the NPM’s best feature is the way it suggests solutions to network problems. Its second best feature is the ability to monitor the health of individual VMware virtual machines. If you are interested in troubleshooting, and creating network maps, then I recommend that you give this Network Performance Monitor a try.
Download your free trial of SolarWinds Network Performance Monitor.
Problem with Network Segment \% Network Utilization
The problem is that it seems to have been discontinued in Windows 2000 onwards. Several respected sites claim you can install Network Segment via the Network Monitor, or Protocol Driver. For what its worth I have tried numerous techniques of getting the counter to appear in performance monitor without success – I agree with Microsoft Network Segment is no longer available.
Microsoft’s TechNet article 253790 Says:
SUMMARY
In Windows 2000, installing Network Monitor does not add the Network Segment object in System Monitor as in Microsoft Windows NT.
MORE INFORMATION
To increase the stability and reliability of the Windows Management Instrumentation (WMI) interface, this object has been removed from System Monitor in the Performance tool in Windows 2000.
Overview of Microsoft Network Monitor 3.2
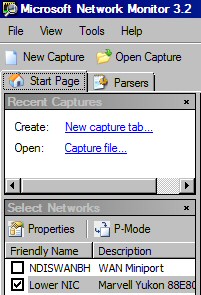
Microsoft Network Monitor v3.2 is a tool which captures TCP/IP frames and displays their source and destination addresses along with detailed information stored in the datagram header. Network Monitor 3.2 works on all modern Windows operating systems, such as Server 2008, Vista, Windows Server 2003 and XP.
Example of Tasks for Microsoft Network Monitor
Whilst it is easy enough to understanding the twin principles of capturing network traffic and displaying information, getting this tool to work can be frustrating for a beginner. It reminds me of learning to windsurf, at first it seems impossible that I could stand up on that board, never mind manoeuvre the sails.
Most of the problems learning to use Network Monitor stem from being swamped by the sheer volume of data that this utility collects. The best way to start your voyage is to focus on the filters. What really helps is if you have a clear purpose for each journey with Netmon, that way you don’t get side-tracked by irrelevant menus. Moreover, each successive journey will be easier because you can navigate by familiar landmarks.
Troubleshooting connectivity problems.
Let us imagine that DNS is not working. If you capture the appropriate frames with the Network Monitor, you may discover from the destination address that your machine is trying to connect to a non-existent DNS server.
Calculating server response times.
Each packet has date / time information, thus you can measure response times for conversations between your computer and various servers. If necessary you could instigate a conversation with ping.
TCP re-transmissions.
A significant number of re-transmissions could indicate an intermittent connection problem.
Identify broadcast traffic.
Broadcast traffic is an old enemy of network managers. You could use seeking broadcast or multicast traffic as an opportunity learn more about Network Monitor, while you check for a well-known network problem.