Introduction to Exchange 2010 Bottlenecks

While Exchange 2010 introduces new Performance Monitoring counters, it’s always best to start your quest for a faster service by checking the ‘old’ memory, processor, disk and network counters first.
As you look for bottlenecks, think how you could improve the service as cheaply as possible, for example move mailboxes to another server.
Topics for Exchange 2010 Performance Monitoring
- Tactics to Detect Exchange Bottlenecks
- Check Exchange Queues with Performance Monitor
- Other Exchange Counters
- Solutions to Exchange Bottlenecks
- Summary of Exchange Performance Monitoring
♠
Tactics to Detect Exchange Bottlenecks
Here are the Windows Server 2010 ‘big four’ counters, memory, processor, disk and network.
Processor(_Total)\% Processor Time – The trace should be less than 80% (Spikes are Ok). On Mailbox servers 80% of this total should be the store.exe process.
Memory\Available Mbytes – Above 150 MB
Disk – Queues less than 2
Network Interface(*)\Bytes Total/sec – Less than 75 Mbps for 1000-megabits network
Virtualization:
Hyper-V Virtual Machine Health Summary\Health Critical – Below 70%
Memory\Available MBytes – Greater than 2MB
Exchange 2010 Counters
When you install Exchange 2010, not only does it expand the schema but it also adds specific exchange performance counters. Incidentally, you also see more services, for example Microsoft Exchange System Attendant.
Once you are satisfied with operating system counters, then investigate these Exchange specific counters:
- MTA (Message Transfer Agent)
- SMTP
- Internet Mail Service
- Directory Service
The more you understand the way Exchange 2010 works, the more you can identify then predict where bottlenecks occur. Performance monitor will not only improve responsiveness, but also help you learn how the Exchange components route the mail messages.
Guy Recommends: A Free Trial of the Network Performance Monitor (NPM) v11.5
v11.5

SolarWinds’ Network Performance Monitor will help you discover what’s happening on your network. This utility will also guide you through troubleshooting; the dashboard will indicate whether the root cause is a broken link, faulty equipment or resource overload.
What I like best is the way NPM suggests solutions to network problems. Its also has the ability to monitor the health of individual VMware virtual machines. If you are interested in troubleshooting, and creating network maps, then I recommend that you try NPM now.
Download a free trial of SolarWinds’ Network Performance Monitor
Check Exchange Queues with Performance Monitor
The key to detecting Exchange 2010 bottlenecks is to isolate the queues, then measure their length. Guy’s rule of thumb is than any queue bigger than 2 means a bottleneck.
Microsoft database threshold maximum 80 milliseconds.
MSExchangeMTA – Work Queue Length is the most important counter because it gives a total for all queues.
To check more precisely measure these counters:
- SMTP Server – Local Queue Length
- SMTP Server Messages received /sec and delivered /sec
- MSExchange ADAccess Processes(*)\LDAP Search Time
- MSExchangeIS – Send and Receive queues size
- MSExchangeMTA Connections – Queue Length
- MSExchangeIS Mailbox -Messages Sent/min Messages Delivered/min
- MSExchangeIS User Count
Solutions to Exchange 2010 Bottlenecks
- Upgrade your server’s memory, add another stick of RAM.
- More disks, remember to add more disk controllers.
- Put Exchange on its own dedicated server.
- Add a second or even a third server so that each site has a local Exchange server.
- Deploy front-end / back-end servers. The front-end servers handle the connections and authentication, the back-end store the actual mailboxes.
- Lateral thinking and root cause analysis. Too much spam? Get a good filter.
Swamped with the Fakav virus, deploy a better virus checker.
 Guy Recommends: The SolarWinds Exchange Monitor
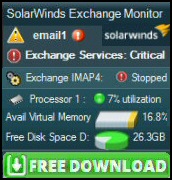
Here is a free tool to monitor your Exchange Server. Download and install the utility, then inspect your mail queues, monitor the Exchange server’s memory, confirm there is enough disk space, and check the CPU utilization.
This is the real deal – there is no catch. SolarWinds provides this fully-functioning freebie, as part of their commitment to supporting the network management community.
Free Download of SolarWinds Exchange Monitor
Resource Monitor for Exchange 2010

In some ways the built-in Resource Monitor is better for identifying bottlenecks than perfmon. In particular for checking for disk response times.
- See more on the Exchange Server blog.
- Also PAL (Performance analysis of logs)
- 7 Ways to Improve Your Exchange Performance
Summary of Exchange 2010 Health Checks
Monitoring Exchange Server 2010 is probably the most difficult of all monitoring tasks. The secret is to start by examining the underlying Windows Server 2008, pay particular attention to the ‘big 4’ counters, Memory, Processor, Disk and Network. Once you have checked that these 4 are not causing the bottleneck, then seek the Exchange specific counters, for example, MSExchangeIS and MSExchangeMTA.
If you like this page then please share it with your friends
See more Microsoft Exchange Server 2010 topics:
• Exchange 2010 • Exchange 2010 Transition • SMTP Auth Login • Address Policies Exchange 2010
• Exchange 2010 Eseutil Commands • Exchange 2010 GAL • Exchange 2010 ExBPA • Home
• Solarwinds Exchange Monitor • Exchange 2010 PowerShell Commands • New-SystemMessage