Performance Monitor Data Collector Sets and Alerts
This page will show you how to design a Data Collection Set, this is the new name for Performance Monitor Alerts. An alert is like a guard that rings an alarm bell when an interesting event occurs. Alerts are a great way of troubleshooting those intermittent problems when ‘Mr Nobody’ is around to see what actually happened.
Performance Alert Topics
- Windows Server 2008 Data Collector Set (Alerts)
- Windows 7 Data Collector Sets
- Windows Server 2003 Alerts Method
- Viewing the Alerts
- Free Tool – Alert Central
♦
Introduction to Alerts and Data Collection Sets
If you take the time to design Alerts or Collection Sets, then you will be rewarded with advance knowledge of problems. As you research the triggers and actions, so you will learn more about how a healthy operating system functions.
Keep an eye out for similarities and differences between Logs and Alerts. For example, Alerts show up in the Application Event Log where as log counters are displayed in the Monitor. Also remember that you can schedule Alerts and Collection Sets in thee same way that you can schedule Logs.
Windows Server 2008 Data Collector Sets (Alerts)

Window Server 2008 introduces ‘Data Collector Sets’, which you can employ to a create data set containing performance counters. Historically, the problem with Performance Monitor in Windows has been its complexity. To help you cut through the maze of settings Microsoft has introduced Data collector sets. The idea is to supply pre-defined templates to tackle a specific area. Windows Server 2008 supplies two main types of template, diagnostics or performance.
From the custom data set you can configure alert activities for when the performance counters are exceeded. Naturally, once you have defined the Data Collector Set, you must configure the actions that Windows Server 2008 will undertake when the alert thresholds are reached.
Detailed Instructions How to Create Alerts in Server 2008
Actually, it often makes more sense to employ Vista or Windows 7 to collect data.
Key question: Which template do you want, a System Diagnostics, a System Performance template, or one of your own design?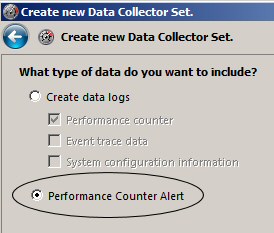
- Assuming you have launched the Windows Reliability and Performance Monitor (Perfmon):
- Expand Data Collector Sets, right-click User Defined
- Choose New, and click Data Collector Set.
- Make sure you select the ‘Create manually option and click Next.
- Crucial step, see screenshot:
Select the Performance Counter Alert - Now add the counters you wish to monitor.
- From the list of Performance counters, select the counter to monitor and trigger an alert.
- Check the logic if whether to alert when the performance counter value is above, or below the limit.
Trap: The Data Collector Set must run as a user who is a member of the Performance Log Users group, alternatively, they can run as a member of the Administrator’s group.
Other Considerations: You could schedule the Data Collection Set to run at a certain time. It’s often helpful to set a ‘Stop condition’. Both strategies are to prevent you being swamped with data.
Guy Recommends: A Free Trial of the Network Performance Monitor (NPM) v12
v12
SolarWinds’ Network Performance Monitor will help you discover what’s happening on your network. This utility will also guide you through troubleshooting; the dashboard will indicate whether the root cause is a broken link, faulty equipment or resource overload.
Perhaps the NPM’s best feature is the way it suggests solutions to network problems. Its second best feature is the ability to monitor the health of individual VMware virtual machines. If you are interested in troubleshooting, and creating network maps, then I recommend that you give this Network Performance Monitor a try.
Download your free trial of SolarWinds Network Performance Monitor.
Windows Server 2003 Alerts
Our goal is to set an performance monitor alert when the processor reaches 70%. The method and screen shots are taken from Windows Server 2003, however the principles are valid for earlier Microsoft operating systems.
Our first step is to launch the Performance Monitor. Perhaps you have added Performance Monitor to your MMC? Or else you can type perfmon in the run box. (See Getting Started if you are stuck
Once Performance Monitor opens, make sure that you click Alerts in the left pane, if necessary expand the Performance Logs and Alerts, see Diagram 1.
Now go to the right pane and right-click with the mouse, now select: New Alert Settings. When the filename box appears, give your alert a meaningful name e.g. Processor. Diagram 1

Click on the Add button, choose the default object Processor % Processor time. So far the procedure is similar to setting a System Monitor trace, but now comes the crucial difference. Find the Limit box and enter 70. Observe that the adjacent box is set to ‘Over’, and now click Close, then OK; see Diagram 2.
The Alerts have an extra Action tab, check the default setting is, "Log an event in the application event log". Later we will visit the Event Viewer and find the Alerts.
The Alert settings are color coded, red means off, while green means sampling in progress. I control the alert by selecting Start or Stop from the short cut menu.
Unless the processor is under stress, you are unlikely to get any Alerts. Test machines will not reach the 70 limit without a little help. So, open a program like Word, the initial execution should fire the alert. If you still do not get any Alerts, reduce the Limit to 30 and then try again. As a last resort, change the alert from Over 70 to Under 70.
Needless to say, if the Alert is red then it is stopped and to start it right-click and select start. Now the Alert will be green.

Viewing your Alerts 

Open the Event Viewer and examine the Application log. (Not System Log)
Seek out SysmonLog entries. Double click the event to check what has happened, see Diagram 3.
Once the alert has served its purpose, go back to Performance Monitor, right-click the green icon and select Stop.
If you make good use of Alerts the log file will soon fill up, so increase the size of the Application Log to 4000 kb.
Another tip is to filter the log so that you just see SysmonLog events.

Summary for Alerts
With Windows Server 2008, Vista and Windows 7 Microsoft has made it much easier to configure alerts by providing Data Collection Sets. These pre-defined templates contain all the counters you would need to tackle a project such as Wireless network performance.
Monitoring Alerts is particularly for intermittent problems with Windows Server 2003. Set an alter to trigger when the counter reaches a suitable threshold. Knowing what values to set is a mystery at first, but if you persevere then you will soon see what worked and what values need adjusting.
At first you wonder where the successful alerts are to be found, but you soon realize the answer: launching the Event Viewer and examining the Application Log.
If you like this page then please share it with your friends
More Help for Detecting Computer Bottlenecks
Download your eBook: The Art and Science of Performance Monitoring for only $5.25
![]() Learn the secrets of which counters to monitor. Master performance monitor logging, develop your skills with structured exercises and examples. Print out a copy to read, while you design logs and alerts to detect network bottlenecks.
Learn the secrets of which counters to monitor. Master performance monitor logging, develop your skills with structured exercises and examples. Print out a copy to read, while you design logs and alerts to detect network bottlenecks.